Download

1 / 12
120 likes | 193 Vues
Tableau is a data visualisation process it's focussed on business intelligence services and Tableau comes with a mapping functionality and it's ability to draw latitude and longitude axises.This tableau deals with enquiries on cloud and rational databases.<br>

E N D
tableau We can help www.onlineitguru.com
introduction Tableau Online Training www.onlineitguru.com
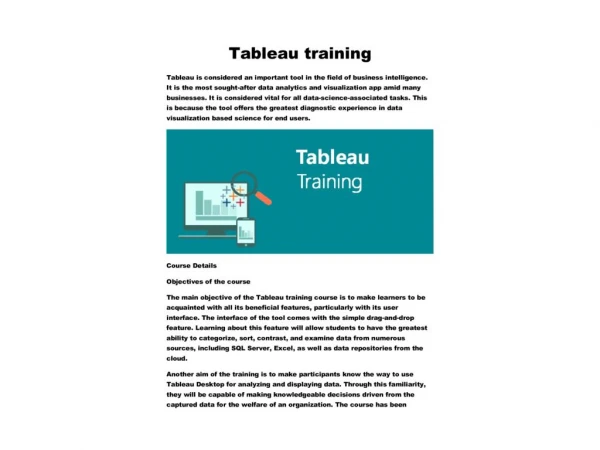
What is Tableau? Tableauis American computer software that interactive data visualization products focus on Business Intelligence specialize in visualization techniques. It explores and analyzes relational databases and data cubes led research on the table-based and display in browse multidimensional relational databases. In Combined structured query language on databases for a descriptive language is for render graph are invented in database visualization language known as VizQL means Visualization Query Language. For core of Polaris system interface on exploring large multi-dimensional databases and product queries in relational databases, cloud database, cubes, and spreadsheets by generates graph types, combined with dashboards and shared into comport network. www.onlineitguru.com
Why should we use tableau We need to have known programming of any sort and some data on tableau that create reports in visually enhance, with drag and drop feature you can create stories easily or reports on small imagination. Those are possible due to revolutionary VizQL a visual query language. VizQL: VizQL is a visual query language to translate drag and drops actions in data query for express, data visually and delivers dramatic increase gain in audience ability to watch and understand data, by abstract on underlying complexities in query and analysis represents advancement in the area of data analysis and visualization. www.onlineitguru.com
Advanced In Memory Technology-The Data Engine: Data analytic software mostly has huge features in almost of them fail on operating with a large amount of data in advanced memory technology of tableau need to provide reports from increasing data. Tableau data engine is a memory analytics database design to overcome limitations on existing databases and data silos, they will run in ordinary systems the complete memory hierarchy. It has disk from L1 cache shifts the curves between big data and fast analysis in power hands. Everyone to know Ad-hoc analysis of massive data collects in seconds by fixed data model. www.onlineitguru.com
Evaluation of Tableau Speed: Strength of Tableau is a greatest speed to analyze a millions of rows and provide the required information answers in seconds. Quality gets in fast business decisions are to be taken. Ease of use: Tableau strength is very simple to use basic drag and drop using Tableau with no prior program experience with basic Excel skills, one can simply learn Tableau. Direct connection: Tableau Permit users instantly connect to databases, data warehouses and cubes. Data access easy without the advanced setup and data will be getting updated on its own and pick tables on spreadsheet s for data no Hadoop to create perfect mash up to get perfect result has no time with simple ad hoc business analytics. www.onlineitguru.com
Growing Market: Tableau is new business Intelligence market used for sharing market share in daily basis from transportation to healthcare on all industries. It is large client base consists of big companies like Deloitte, Nokia, Microsoft, and PWC are use Tableau in daily basis to encounter on Business Intelligence requirements. www.onlineitguru.com
Future Scope of Tableau • One of the best data visualization tool is that Tableau fastest growing BI tool in the market nowadays there are a good amount of work that provided with cutting edges technologies for Tableau online training. www.onlineitguru.com
Right audience to study Tableau By learning Tableau it is Ease of use and it has power to do anything for ability to connect any data and merge, it means blend data from multiple sources and allows faultless contribution on dashboards of a server. One can work on an Analytical part of data information to get desired output and dashboard creation on certain information of data, you can also spend some time to learn for improving the appearance of graphs by the tools. Recommended Audience: Tableau is not programming software require expensive programming language. Programming ideas and skill immense interest to manage the data in right way.• Developers• Project Manger• Data Analysts• Non-BI professionals www.onlineitguru.com
Prerequisites: In Basic Knowledge on data that is required for the fundamental idea of managing the data and implementation in practical ,no need to be much knowledge on software and programming Skills. Must contain initial idea regarding the use of Excel or the worksheets are used to understand the entire design of Tableau. click hear to enroll in Tableau online training Get in touch with OnlineITGuru and get a master in Tableau Software www.onlineitguru.com
Any Queries…? INDIA: +919550102466 USA: +1 469 522 9879 Email: info@onlineituru.com Blog: https://onlineitguru.com/blog/why-should-we-use-tableau To know more about course go to this Link: https://onlineitguru.com/tableau-online-training-placement.html www.onlineitguru.com