Understanding Inequalities and Number Lines
Learn about graphing inequalities on a number line, interpreting symbols, and identifying solutions in this comprehensive guide.


Understanding Inequalities and Number Lines
E N D
Presentation Transcript
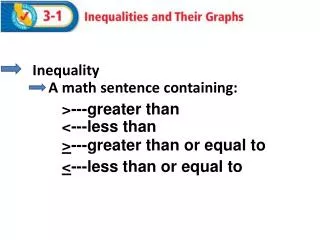
> ≥ < ≤ ≠ Inequality
> ≥ < = less than = greater than = greater than or equal to ≤ ≠ Inequality = not equal to = less than or equal to
Inequality Using a Number line: Recall that a number line is a horizontal line that has points which correspond to numbers. The points are spaced according to the value of the number they correspond to; in a number line containing only whole numbers or integers, the points are equally spaced.
Inequality • > = greater than We can also graph inequalities on the number line. The following graph represents the inequality x > 2 ½ . The dark line represents all the numbers that satisfy x > 2 ½ . If we pick any number on the dark line and plug it in for x, the inequality will be true. The open circle at 2 ½ shows that 2 ½ is not a solution for x.
Inequality • ≥ = greater than or equal to The following graph represents the inequality x ≥ 2 ½ . The dark line represents all the numbers that satisfy x ≥ 2 ½ . If we pick any number on the dark line and plug it in for x, the inequality will be true. The closed circle at 2 ½ shows that 2 ½ is a solution for x.
Inequality • < = less than The following graph represents the inequality x < 2 ½ . The dark line represents all the numbers that satisfy x < 2 ½ . If we pick any number on the dark line and plug it in for x, the inequality will be true. The open circle at 2 ½ shows that 2 ½ is not a solution for x.
Inequality • ≤ = less than or equal to The following graph represents the inequality x ≤ 2 ½ . The dark line represents all the numbers that satisfy x ≤ 2 ½ . If we pick any number on the dark line and plug it in for x, the inequality will be true. The closed circle at 2 ½ shows that 2 ½ is a solution for x.
Inequality ≠ • = not equal to An inequality with a " ≠ " sign has a solution set which is all the real numbers except a single point (or a number of single points). Thus, to graph an inequality with a " ≠ " sign, graph the entire line with one point removed. For example, the graph of x ≠ 2 ½ looks like: Notice how the whole number line is covered with a dark line. Notice the open circle at 2 ½. This means that all the points covered by the dark line except 2 ½ are a solution to x 2 ½ ≠
Pair Share 1’s tell 2’s: What are the symbols used for inequalities and what do they mean? < less than, > greater than, ≥ greater than or equal to, ≤ less than or equal to, ≠ not equal to. 2’s tell 1’s: How do you identify if a number is or is not part the solution for an inequality? The closed circle means the number is part of the solution. An open circle means the number is not part of the solution.
Practice Using the following number line, identify the solution to the inequalities. Y > 4 X < 3 5 ≥ r
Practice Create an inequality to match the number line. X > -1 or -1 < x
Practice Create an inequality to match the number line. X ≤ -1 or -1 ≥ x
Practice Create an inequality to match the number line. X -1 or -1 x ≠ ≠
Practice Create an inequality to match the number line. X ≥ -1 or -1 ≤ x
Practice Create an inequality to match the number line. X < -1 or -1 > x