Download
1 / 24
240 likes | 351 Vues
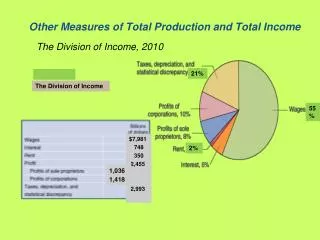
Other Measures of Total Production and Total Income. The Division of Income, 2010. 21%. FIGURE 7-5. The Division of Income. 55%. $7,981 748 350 2,455 2,993. 2%. 1,036 1,418. Measuring the Unemployment Rate and the Labor Force Participation Rate. The Household Survey.

E N D
Other Measures of Total Production and Total Income The Division of Income, 2010 21% FIGURE 7-5 The Division of Income 55% $7,981 748 350 2,455 2,993 2% 1,036 1,418
Measuring the Unemployment Rate and the Labor Force Participation Rate The Household Survey • Labor forceThe sum of employed and unemployed workers in the economy. • Employed can be in any job -- part-time, underemployed • Unemployment rate The percentage of the labor force that is unemployed: not working and looking. Discouraged workers: Available for work but haven’t looked for a job (for the past four weeks) because they believe no jobs are available for them.
The Household Survey Measuring the Unemployment Rate and the Labor Force Participation Rate The Employment Status of the Civilian Working-Age Population, July 2009 In July 2009, the working-age population of the United States was 235.9 million. The working-age population is divided into those in the labor force (154.5 million) and those not in the labor force (81.4 million). The labor force is divided into the employed (140.0 million) and the unemployed (14.5 million). Those not in the labor force are divided into those not available for work (75.0 million) and those available for work but not currently working (6.4 million). Finally, those available for work but not in the labor force are divided into discouraged workers (0.8 million) and those not currently looking for work for other reasons (5.6 million).
240.1 154.0 86.1 14.0 140.0 6.2 79.9 The Employment Status of the Civilian Working-Age Population, April 2007 1.0 Sept 2011 5.2
• Unemployment rate: the percentage of the labor force that is unemployed … not working and looking. • Labor force participation rate: the percentage of the working-age civilian population in the labor force.
Men Women
The Establishment Survey: Another Measure of Employment Household and Establishment Survey Data for March and April 2007
Types of Unemployment Frictional Unemployment and Job Search Frictional unemployment Short-term unemployment that arises from the process of matching workers with jobs. Structural Unemployment • Structural unemployment Unemployment because of persistent mismatch between worker skills and characteristics and job requirements. • Declining industries and regions / Expanding industries and regions Cyclical Unemployment Cyclical unemployment Unemployment caused by a business cycle recession.
Full employment is not considered to be zero unemployment because • a) some cyclical unemployment always exists • b) some people do not want a job • c) there are not enough jobs for everyone who wants one • d) people do not find jobs right away
Explaining Unemployment Unemployment Insurance and Other Payments to the Unemployed Minimum Wage Laws Seniority / Probation Periods Labor Unions / Work Rules • Efficiency Wages: • higher-than-market wage that a firm pays to increase worker productivity wait unemployment. • Reduce hiring costs, turnover, monitoring costs, shirking • Increase morale Deficient Demand
Government Policies and the Unemployment Rate Average Unemployment Rates in the United States, Canada, Japan, and Europe, 1997–2006
If the federal government implements programs so that the unemployed are more quickly matched with jobs, the natural rate of unemployment will decrease. • a) True b) False • Eliminating frictional employment would be good for the economy. • a) True b) False
Measuring Inflation Price level (= P) A measure of the average prices of goods and services in the economy. Inflation rate (= π) The percentage increase in the price level from one year to the next. Π = 100 x (Pt - Pt-1 ) / Pt-1 • Price Indices of Note • GDP Deflator • Consumer Price Index • Core CPI: CPI excluding energy and food • Producer Price Index
Measuring Inflation The CPI Market Basket, December 2006 The Consumer Price Index
The Consumer Price Index Consumer price index (CPI) An average of the prices of the goods and services purchased by the typical urban family of four.
CPI = The Consumer Price Index 2008 - 2009 Inflation Rate = Π = 100 x (P2009 - P2008 ) / P2008 Π =
Is the CPI Accurate? • Substitution bias. • Increase in quality bias. • New product bias. • Outlet bias. CPI inflation overstates the increase in the “Cost of Living”
The GDP deflator is the best measure of the prices of goods and services purchased by American households. • a) True b) False • Because of substitution bias, businesses over-compensate employees when giving cost-of-living increases based on the CPI • a) True b) False
Real versus Nominal Interest Rates Nominal interest rate: The stated interest rate on a loan. Real interest rate: The nominal interest rate minus the inflation rate. Real interest rate = Nominal interest rate − Inflation rate Deflation A decline in the price level.
Real versus Nominal Interest Rates The real interest rate is equal to the nominal interest rate minus the inflation rate. The real interest rate provides a better measure of the true cost of borrowing and the true return on lending than does the nominal interest rate. The nominal interest rate in the figure is the interest rate on three-month U.S. Treasury bills. The inflation rate is measured by the percentage change in the CPI from the same quarter during the previous year.
Does Inflation Impose Costs on the Economy? The Problem with Anticipated Inflation Menu costs The costs to firms of changing prices. Price Uncertainty fear Stagnation The Problem with Unanticipated Inflation • Inflation Affects the Distribution of Income • Arbitrary redistribution • Debtors gain / Creditors lose disincentive to save • Pensioners lose Deflation: Debtors Lose ... Creditors Lose ... Vicious Downward Spiral
K e y T e r m s Natural rate of unemployment Nominal interest rate Price level Producer price index (PPI) Real interest rate Structural unemployment Unemployment rate Consumer price index (CPI) Cyclical unemployment Deflation Discouraged workers Efficiency wage Frictional unemployment Inflation rate Labor force Labor force participation rate Menu costs