Download
1 / 4
40 likes | 172 Vues
Ve č erek et al. Supplementary Figure S1. Figure S1. Hfq wt and Hfq 65 binding to Cy5/Cy3-labeled RNA 21mers. Indicated amounts of Hfq wt (A) or Hfq 65 (B) were incubated with 5 nM RNA in 100 µl buffer (50 mM Tris-HCl, 3 mM MgCl 2 , 1 mM DTT) at 37°C for 30 min. Binding was measured

E N D
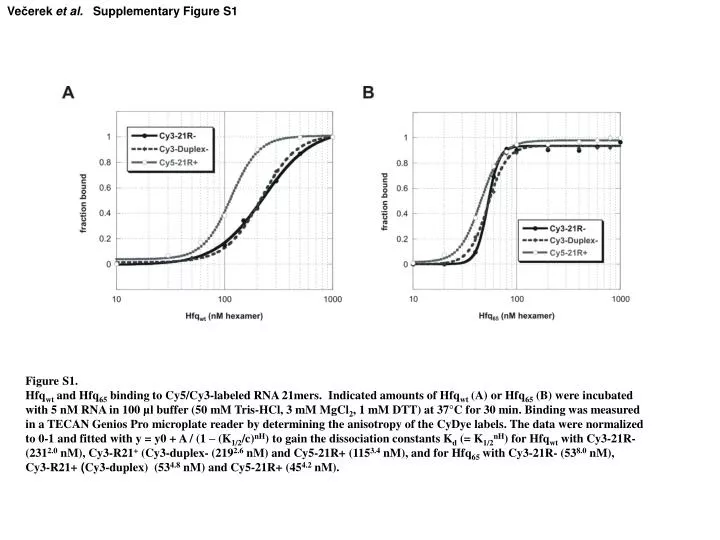
Večerek et al. Supplementary Figure S1 Figure S1. Hfqwt and Hfq65 binding to Cy5/Cy3-labeled RNA 21mers. Indicated amounts of Hfqwt (A) or Hfq65 (B) were incubated with 5 nM RNA in 100 µl buffer (50 mM Tris-HCl, 3 mM MgCl2, 1 mM DTT) at 37°C for 30 min. Binding was measured in a TECAN Genios Pro microplate reader by determining the anisotropy of the CyDye labels. The data were normalized to 0-1 and fitted with y = y0 + A / (1 – (K1/2/c)nH) to gain the dissociation constants Kd (= K1/2nH) for Hfqwt with Cy3-21R- (2312.0 nM), Cy3-R21+ (Cy3-duplex- (2192.6 nM) and Cy5-21R+ (1153.4 nM), and for Hfq65with Cy3-21R- (538.0 nM), Cy3-R21+ (Cy3-duplex) (534.8 nM) and Cy5-21R+ (454.2 nM).
Večerek et al. Supplementary Figure S2 Figure S2. The C-terminus of Hfq is structurally disordered. The protein sequence of Hfq was analyzed using the PONDR VL-XT algorithm at www.pondr.com (75,76,77). High PONDR scores indicate that the respective amino acid belongs to an unstructured region with the threshold set at 0.5. The thick bar on the threshold line indicates a region of more than 40 consecutive residues at the C-terminus predicted to be disordered.
A B hfq-lacZ sodB-lacZ OD600 β- gal acivity (%) HfqSa HfqSa HfqBs HfqBs 1 2 3 4 HfqBs HfqSa HfqEc C hfq126 mRNA sodB192 mRNA 1 2 3 4 5 6 7 8 9 10 11 12 13 Večerek et al. Supplementary Figure S3
Figure S3. S. aureus Hfq (HfqSa) and B. subtilis Hfq (HfqBs) are defective in regulation of the E. coli hfq gene and in riboregulation in E. coli. (A) The E. coli strains AM111F´ (pACYC184) (■), AM111F´(pASA) (▲) and AM111F´(pABS) (●) were grown overnight in LB-broth, washed with M9-minimal medium, and then resuspended to an OD600 of 0.05 in M9-minimal medium containing 0.2% succinate and 2,2´-dipyridyl (50 mM final concentration). Growth was followed by measuring the OD600 at the times indicated. After 12 h, the plasmid encoded genes were induced by addition of IPTG (100 μM) and after 24 h samples were taken for verification of Hfq synthesis (see bottom panel). Total protein samples from AM111F´ (pACYC184) (lane 1), AM111F´(pASA) (lane 2) and AM111F´(pABS) (lane 3) were loaded onto a 12% SDS-polyacrylamide gel. Purified Hfq protein from S. aureus was loaded as a control (lane 4). Only the relevant section of the silver stained gel is shown.(B) Translation of hfq131-lacZ mRNA in the absence of Hfq (white bar), in the presence of E. coli Hfqwt (black bar), HfqSa (striped bar) and HfqBs (grey bar) in strains AM111F´(pRhfq131; pACYC184), AM111F´(pRhfq131; pAHfq), AM111F´(pRhfq131; pASA) and AM111F´(pRhfq131; pABS) grown in LB medium, respectively (left panel). Translation of sodB-lacZ mRNA in the absence of Hfq (white bar), in the presence of E. coli Hfqwt (black bar) , HfqSa (striped bar) and HfqBs (grey bar) in strains AM111F´(pRsodB; pACYC184), AM111F´(pRsodB; pAHfq), AM111F´(pRsodB; pASA) and AM111F´(pRsodB; pABS) grown in M9 medium, respectively (right panel). The averaged β-galactosidase levels obtained in the absence of Hfq was set to 100 % (white bar). The error bars represent standard deviations. Bottom: Determination of the levels of HfqSa and HfqBs in the respective strains by SDS-PAGE. Purified HfqSa was loaded as a control. (C) 5´end-labelled hfq126 mRNA (upper panel) and sodB192 mRNA (lower panel) were incubated in the absence (lane 1), in the presence of 5 nM (lane 2 and 7), 10 nM (lanes 3 and 8), 20 nM (lanes 4 and 9), 40 nM (lanes 5 and 10) and 80 nM (lanes 6 and 11) HfqBs- and HfqSa-hexamer, respectively. As a control, both mRNAs were incubated with 10 nM (lane 12) and 20 nM (lane 13) E. coli Hfqwt. The molar concentration of either mRNA fragment used was 5 nM. The band shift assays were performed as described in MATERIALS and METHODS.