Download
1 / 1
10 likes | 147 Vues
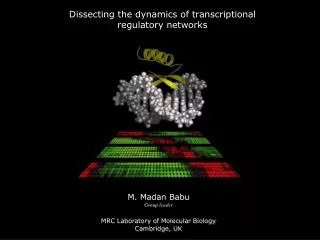
This study presents a comprehensive approach to discovering transcriptional regulatory networks (TRNs) by leveraging Gene Ontology (GO) and phylogenetic similarity analysis. We hypothesize that gene pairs with similar GO descriptions are more likely to be regulated similarly. The integration of multiple bioinformatics methods results in enhanced predictions of gene and transcription factor (TF) interactions. Our application focuses on B cells, uncovering networks that underlie microbial behavior with potential implications for environmental remediation and energy production, validated against published experimental results.

E N D
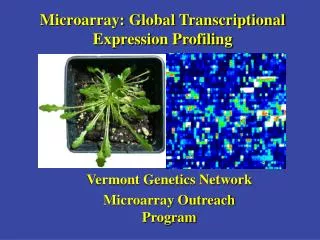
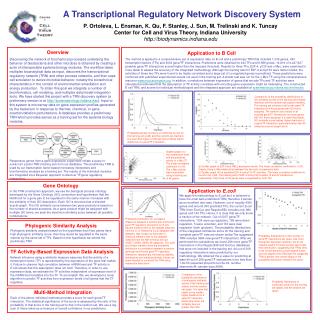
Gene Ontology In the TRN construction approach, we use the biological process ontology developed by the Gene Ontology (GO) consortium and hypothesize that the likelihood for a gene pair to be regulated in the same manner increases with the similarity of their GO description. Each GO is structured as a directed acyclic graph. The GO similarity score between two gene products is based on the number of shared ancestors. As a gene product might be assigned with multiple GO terms, we seek the maximum similarity score between all possible combinations. Probability distribution for correlation (Pearson) between a random pair and known gene/TF regulatory interaction for E.coli. Square markers refer to the dataset obtained from the U. of Oklahoma E.coli database (89 datasets; http://chase.ou.edu/macro/). Diamond markers refer to the datasets obtained from the NIH omnibus service (GSE7, GSE8, GSE9; 65 datasets). The solid and hollow markers show the probability distribution for correlation between a random gene pair and known gene/TF regulatory interaction, respectively. As these probability distributions are indistinguishable, it does not seem feasible to construct the TRN using expression data alone. Phylogenic Similarity Analysis Phylogenic similarity analysis based on the hypothesis that if two genes have high phylogenic similarity score, then they would be regulated in the same manner by the same set of TFs. Based on this hypothesis we extend the preliminary TRN. Comparison of the probability distributions of phylogenic similarity scores of the training set (black) and the random set (gray). It is seen that higher score implies higher likelihood of a gene/TF interaction, particularly when the similarity score is greater than 500. Probability distribution of combined scores for the training set (black) and the random set (gray). Multi-Method Integration Each of the above individual methods provides a score for each gene/TF interaction. The statistical significance of the score is assessed by the ratio of the probability of that score in the training set to that in the random set. We use a log-sum of these ratios as a measure of overall confidence in our predictions. A Transcriptional Regulatory Network Discovery System P. Ortoleva, L. Ensman, K. Qu, F. Stanley, J. Sun, M. Trelinski and K. Tuncay Center for Cell and Virus Theory, Indiana University http://biodynamics.indiana.edu Overview Application to B Cell Discovering the network of biochemical processes underlying the behavior of Geobacteria and other microbes is obtained by creating a suite of interoperable systems biology modules. The workflow takes multiplex bioanalytical data as input, discovers the transcriptional regulatory network (TRN) and other process networks, and then uses cell simulation to derive microbial behavior, notably the biotechnical characteristics in the context of environmental remediation and energy production. To attain this goal we integrate a number of bioinformatics, cell modeling, and multiplex data/model integration tools. We have started this project with a TRN discovery system (a preliminary version is at http://systemsbiology.indiana.edu). Input to this system is microarray data on gene expression profiles generated by the bacterium in response to thermal, chemical, or gene insertion/deletion perturbations. A database provides a preliminary TRN which provides serves as a training set for the systems biology modules. The method is applied to a comprehensive set of expression data on B cell and a preliminary TRN that included 1,335 genes, 443 transcription factors (TFs) and 4032 gene/TF interactions. Predictions were obtained for 443 TFs and 9,589 genes. 14,616 of 4,247,927 possible gene/TF interactions scored higher than the imposed threshold. Results for three TFs, E2F-4, p130 and c-Myc, were examined in more detail to assess the accuracy of the integrated methodology. Although the training sets for E2F-4 and p130 were rather limited, the activities of these two TFs were found to be highly correlated and a large set of co-regulated genes is predicted. These predictions were confirmed with published experimental results not used in the training set. A similar test was run for the c-Myc TF using the comprehensive resource www.myccancergene.org. In addition, correlations between expression of genes that encode TFs and TF activities were calculated and showed that the assumption of TF activity correlates with encoding gene expression might be misleading. The constructed B cell TRN, and scores for individual methodologies and the integrated approach are available at systemsbiology.indiana.edu/trndresults. Comparison of the probability distributions of GO similarity scores of the training set (triangle markers) and the random set (square markers). The training set consists of all known gene/TF interactions for those genes with GO terms assigned. The random set consists of all possible gene/TF interactions for those genes with GO terms assigned. It is seen that higher GO similarity score implies higher likelihood of a gene/TF interaction, particularly when the GO similarity score is larger than 9. Probability density functions of combined scores for the training set (solid) and the random set (dashed). It is seen that higher combined score implies higher likelihood of a gene/TF interaction. Scatter graph of c-myc expression level and the predicted activity of c-Myc TF. The linear correlation coefficient is 0.49. The c-Myc activity was constructed using a training set of 44 genes. Responsive genes from a gene-expression experiment initiate a query to extract an a priori TRN (training set) from our database. This preliminary TRN is used by our transcription factor-based microarray interpreters and bioinformatics modules as a training set. The results of the individual modules are integrated via a Bayesian approach to discover TF/gene regulatory interactions. a) Scatter graph of E2F-4 and RBL2 expression levels. The linear correlation coefficient is -0.36. Clearly, there is little relationship between the two sets of expression data. b) Scatter graph of the predicted E2F-4 and p130 TF activities. The linear correlation coefficient is found to be -0.80. The training sets of E2F-4 and p130 included 12 and 43 interactions, respectively. Only three of the genes were coregulated by both TFs. Application to E.coli We apply the methodology to E.coli as it is believed to have the most well understood TRN; therefore it serves as an excellent test case. However, out of roughly 4300 genes and around 300 predicted TFs, the current E.coli TRN (from EcoCyc and RegulonDB) includes only 984 genes and 144 TFs. Hence, it is clear that we only know a fraction of the network. Out of 2007 gene/TF interactions, 1124 were up regulation, 766 were down regulation, 5 were uncertain, and 112 were dual regulation (both up/down). The probability distributions of the integrated confidence score for the training and complete gene/TF sets are shown below.The suggested TRN includes 3694 new gene/TF interactions. After we performed the calculations we found 206 more gene/TF interactions in the RegulonDB and EcoCyc databases that were not included in the training set. 44 out of 206 regulatory interactions were predicted by our methodology. We obtained the p-value for predicting at least 44 out of 206 gene/TF interactions to be less than 1.0e-50 (expected proportion=3.5e-04, number observed=44, sample size=3694). Probability distributions for the number of gene/TF interactions per gene. Like most biological interaction networks, the E.coli network seems to follow a power law (scale free) distribution, suggesting that TRNs tend to be connected among high-degree nodes and low-degree ones Although the suggested TRN is denser, the overall shape of the probability distribution remains the same. TF Activity-Based Expression Data Analysis Network inference using a similarity measure assumes that the activity of a transcription factor (TF) is represented by the expression of the gene that makes it. Failure to observe high correlation between mRNA level and TF activity in E.coli shows that this assumption does not hold. Therefore, in order to use expression data, we estimate the TF activities independent of expression level of the mRNA that translates into the TF. To accomplish this, we developed a novel algorithm to predict TF activities from expression levels of all genes that the TF regulates.