Buffer Cache Waits
Buffer Cache Waits. In This Section. latch: cache buffers chains latch: cache buffers lru chain latch: cache buffer handles Free Buffer Wait Buffer Busy Wait Write Complete Wait Buffer Exterminate. Buffer Cache. Locks. Buffer Cache.


Buffer Cache Waits
E N D
Presentation Transcript
In This Section • latch: cache buffers chains • latch: cache buffers lru chain • latch: cache buffer handles • Free Buffer Wait • Buffer Busy Wait • Write Complete Wait • Buffer Exterminate
Buffer Cache Locks Buffer Cache Lib Cache Redo Network IO
SGA Log Buffer Buffer Cache Library Cache Buffer Cache Log Buffer Oracle Memory Structures DBWR LGWR User1 User2 User3 REDO Log Files Data Files
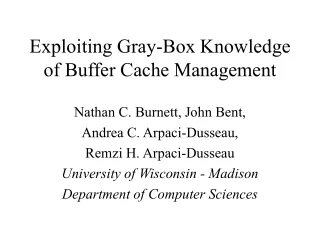
Buffer Cache Access • Buffer Cache Management • Locating Free blocks • Finding data blocks • Managing LRU lists • Cleaning Dirty Blocks • Buffer Cache management can cause contention • Different from IO ( reading blocks of disk )
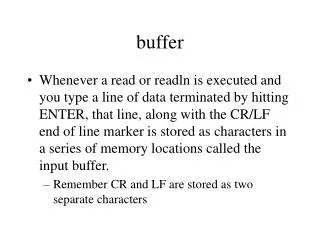
Query Select ename from emp where empno = 12; 0. Parse statement • Find object information in data dictionary • Calculate execution plan • If full table scan • Look at all blocks of table • If index find root of index and follow to key • Data Dictionary will have info about table or index block • File # • Block # • Once you know the block DBA (file# + block#) …
Is Block in cache? Now you have a file# and block# How do you know if a block is cached? Shadow Process ? Do you search all the blocks? Could be 1000s of blocks to search. Buffer caches are in the multi Gig
Buffer Cache Find a block by: 1) Hash of Data file # Block# 2) Result = Bucket # 3) Search linked list for that bucket # What is a hash value What are Buckets What is the linked list?
Concepts To understand contention on the buffer cache, need to understand : • Linked Lists • Hashing • Buckets
Double Linked Lists Address 03C38F60 03C39000 03C39478 03C39000 Next 03C39478 03C38F60 Previous 03C39000
Hashing Function • Simple hash could be a Mod function • 1 mod 4 = 1 • 2 mod 4 = 2 • 3 mod 4 = 3 • 4 mod 4 = 0 • 5 mod 4 = 1 • 6 mod 4 = 2 • 7 mod 4 = 3 • 8 mod 4 = 0 • Using “mod 4” as a hash funtion creates 4 “buckets” to store things
Hash Bucket Fill Data Block Hash Block’s file# block #’s Result in a bucket# Put Block in bucket 0 ? Hash Block’s 1 file# 437 block #’s (1+437) mod 4 = 2 1 ? 2 ? 3 ? After a while the buckets become populated with blocks
Latches Protect Bucket Contents Buffer Headers Hash bucket Data Blocks latches Buffer Headers contents described by X$BH
X$bh SQL> desc x$bh Name Type ------------ -------- ADDR RAW(4) DBARFIL NUMBER DBABLK NUMBER OBJ NUMBER HLADDR RAW(4) NXT_HASH RAW(4) PRV_HASH RAW(4) … much more • Describes Contents of Buffer Headers ADDR DBARFIL DBABLK OBJ HLADDR NXT_HASH PRV_HASH … A each buffer header contains Information about the data block It points to and the previous and next Buffer header in a linked list
Cache ADDR 03C38F60 03C39000 03C39478 03C39000 03C39478 NXT_HASH 03C38F60 03C39000 PRV_HASH
X$BH describes Headers Buffer Headers Hash bucket Data Blocks latches HLADDR ADDR ADDR NXT_HASH x$bh ADDR DBARFIL DBABLK OBJ HLADDR NXT_HASH PRV_HASH PRV_HASH DBARFIL DBABLK OBJ
To Find a Block Hash bucket Buffer Headers Data Blocks latches Shadow Process 4 2 3 5 1 • Hash the block address • Get Bucket latch • Look for header • Found, read block in cache • Not Found Read block off disk 2 3 4 5
Cache Buffers Chains Hash Buckets latches Block Headers Sessions Data Blocks s5 Cache Buffer Chain s4 s3 s2 s1 Contention if too many accesses on a bucket
Examples S4 S3 S2 S1 • Look up Table • Nested Loops t1 t2 Index_t2 Select t1.val, t2.val from t1, t2 where t1.c1 = {value} and t2.id = t1.id;
CBC Solutions Find SQL ( Why is application hitting the block so hard? ) • Nested loops, possibly • Hash Partition • Uses Hash Join • Hash clusters • Look up tables (“select language from lang_table where ...”) • Change application • Use plsql function • Spread data out to reduce contention • Select from dual • Possibly use x$dual How do you find the SQL?
CBC: Statspack 9i Top 5 Timed Events ~~~~~~~~~~~~~~~~~~ % Total Event Waits Time (s) Ela Time ---------------------------- ------------ ----------- -------- latch free 21,428 1,914 81.37 CPU time 360 15.29 PL/SQL lock timer 16 48 2.04 SQL*Net message from dblink 4,690 14 .58 db file sequential read 1,427 5 .19 Top 5 Timed Events ~~~~~~~~~~~~~~~~~~ % Total Event Waits Time (s) Ela Time ---------------------------- ------------ ----------- -------- latch free 21,428 1,914 81.37 CPU time 360 15.29 PL/SQL lock timer 16 48 2.04 SQL*Net message from dblink 4,690 14 .58 db file sequential read 1,427 5 .19 Latch Sleep breakdown for DB: CDB Instance: cdb Snaps: 1 -2 -> ordered by misses desc Latch Name Requests Misses Sleeps Sleeps 1->4 -------------------- ---------- ------- ------ ------------ cache buffers chains 12,123,500 608,415 15,759 0/0/0/0/0 library cache pin 12,027,599 173,446 2,862 172694/743/8/1/0 library cache 12,072,503 98,065 2,373 97739/279/47/0/0 simulator lru latch 606 436 434 6/426/4/0/0 Fails to find SQL
CBC: Statspack 10g Top 5 Timed Events Avg %Total ~~~~~~~~~~~~~~~~~~ wait Call Event Waits Time (s) (ms) Time ---------------------------------- ----------- ------ ------ CPU time 35 54.3 latch: cache buffers chains 46 11 243 17.6 latch: library cache pin 35 8 229 12.6 latch: library cache 27 6 231 9.8 log file sequential read 15 1 60 1.4 Top 5 Timed Events Avg %Total ~~~~~~~~~~~~~~~~~~ wait Call Event Waits Time (s) (ms) Time ---------------------------------- ----------- ------ ------ CPU time 35 54.3 latch: cache buffers chains 46 11 243 17.6 latch: library cache pin 35 8 229 12.6 latch: library cache 27 6 231 9.8 log file sequential read 15 1 60 1.4 Fails to find SQL
CBC: ASH select count(*), sql_id, nvl(o.object_name,ash.current_obj#) objn, substr(o.object_type,0,10) otype, CURRENT_FILE# fn, CURRENT_BLOCK# blockn from v$active_session_history ash , all_objects o where event like 'latch: cache buffers chains' and o.object_id (+)= ash.CURRENT_OBJ# group by sql_id, current_obj#, current_file#, current_block#, o.object_name,o.object_type order by count(*) / SQL Statement: Success Extra: Hot block CNT SQL_ID OBJN OTYPE FN BLOCKN ---- ------------- -------- ------ --- ------ 84 a09r4dwjpv01q MYDUAL TABLE 1 93170
CBC: ADDM Problem SQL Statement Solution?
CBC – Further Investigation select * from v$event_name where name = 'latch: cache buffers chains' EVENT# NAME ---------- ---------------------------- 58 latch: cache buffers chains PARAMETER1 PARAMETER2 PARAMETER3 ---------- ---------- ---------- address number tries NOTE: _db_block_hash_buckets = # of hash buckets _db_blocks_per_hash_latch = # of hash latches
CBC: what’s the hot block • Can get it from ASH • Current_file# • Current_block# • Where event=‘latch: cache buffers chains” • Sometimes file and block = 0 • Seems to happen for Nested Loops • Get the hot block real time • Use Hash Latch Address • Ash.p2 = x$bh.hladdr
Hot Block: X$BH.TCH • Updated when block read • Updated by no more than 1 every 3 seconds • Can be used to find “hot” blocks • Note: set back to zero when block cycles through the buffer cache
CBC – Real Time select count(*), lpad(replace(to_char(p1,'XXXXXXXXX'),' ','0'),16,0) laddr from v$active_session_history where event='latch: cache buffers chains' group by p1; COUNT(*) LADDR ---------- ---------------- 4933 00000004D8108330 select o.name, bh.dbarfil, bh.dbablk, bh.tch from x$bh bh, obj$ o where tch > 100 and hladdr='00000004D8108330' and o.obj#=bh.obj order by tch NAME DBARFIL DBABLK TCH ----------- ------- ------ ---- EMP_CLUSTER 4 394 120
Putting into one Query This can be misleading, as TCH gets set to 0 ever rap around the LRU and it only gets updated once every 3 seconds, so in this case DUAL was my problem table not MGMT_EMD_PING select name, file#, dbablk, obj, tch, hladdr from x$bh bh , obj$ o where o.obj#(+)=bh.obj and hladdr in ( select ltrim(to_char(p1,'XXXXXXXXXX') ) from v$active_session_history where event like 'latch: cache%' group by p1 having count(*) > 5 ) and tch > 5 order by tch NAME FILE# DBABLK OBJ TCH HLADDR ------------- ----- ------ ------ --- -------- BBW_INDEX 1 110997 66051 17 6BD91180 IDL_UB1$ 1 54837 73 18 6BDB8A80 VIEW$ 1 6885 63 20 6BD91180 VIEW$ 1 6886 63 24 6BDB8A80 DUAL 1 2082 258 32 6BDB8A80 DUAL 1 2081 258 32 6BD91180 MGMT_EMD_PING 3 26479 50312 272 6BDB8A80
Consistent Read Blocks Both have same file# and block# and hash to same bucket Current Block (XCUR) Consistent Read (CR) Clone & Undo s2 s1 Select Update
CBC: Consistent Read Blocks Hash Buckets Block Headers latches s5 Cache Buffer Chain s4 s3 Max length : _db_block_max_cr_dba 10g = 6 s2 s1 Contention: Too Many Buffers in Bucket
Consistent Read Copies select count(*) , name , file# , dbablk , hladdr from x$bh bh , obj$ o where o.obj#(+)=bh.obj and hladdr in ( select ltrim(to_char(p1,'XXXXXXXXXX') ) from v$active_session_history where event like 'latch: cache%' group by p1 ) group by name,file#, dbablk, hladdr having count(*) > 1 order by count(*); CNT NAME FILE# DBABLK HLADDR --- ---------- ------ ------- -------- 14 MYDUAL 1 93170 2C9F4B20
CBC : Solution select ash.sql_id, count(*), sql_text from v$active_session_history ash, v$sqlstats sql where event='latch: cache buffers chains' and sql.sql_id(+)=ash.sql_id group by ash.sql_id, sql_text; • Fine the SQL causing the problem • Change Application Logic • Eliminate hot spots • Look up tables • Uses pl/sql functions • Minimize data per block • Possibly using x$dual instead of dual • Index Nested loops • Hash join • Hash partition index • Hah Cluster • Updates, inserts , select for update on blocks while reading those blocks • Cause multiple copies
Latch: cache buffer handles Buffers can be pinned Possibly increase _db_handles_cached 5 Unsupported Used when pinning block headers for expected reuse
Free Buffer Wait • Data Block Cache lack free buffers • Tune by • Increase data blocks • Try to tune DBWR • Improving Inefficient SQL • requesting large # of blocks
Free Buffer Wait Finding a Free Block • If the data block isn’t in cache • Get a free block and header in the buffer cache • Read it off disk • Update the free header • Read the block into the buffer cache Need Free Block to Read in New Data Block
Shadow Process Finding a Free Block When a session reads a block Into the bufffer cache how does it find a FREE spot?
Finding a Free Block Buffer Headers Hash bucket Data Blocks latches • Arrange the Buffer Headers into an LRU List • Scan LRU for a free block
Cache Buffers LRU = entry in x$bh
X$bh SQL> desc x$bh Name Type ---------------------- --------- ADDR RAW(4) DBARFIL NUMBER DBABLK NUMBER OBJ NUMBER HLADDR RAW(4) NXT_HASH RAW(4) PRV_HASH RAW(4) NXT_REPL RAW(4) PRV_REPL RAW(4) • Describes Buffer Headers Cache buffer chains HLADDR RAW(4) NXT_HASH RAW(4) PRV_HASH RAW(4) NXT_REPL RAW(4) PRV_REPL RAW(4) LRU
LRU Chain ADDR 03C38F60 03C39000 03C39478 03C39000 03C38F60 NXT_HASH 03C38F60 03C39000 PRV_HASH 03C385F4 03C39478 03C38638 NXT_REPL PRV_REPL 03C38554 03C38514 03C38620
Cache Buffers LRU list LRU Chain of Buffer Headers Buffer Cache
Cache Buffers LRU Latch Buffer Headers LRU MRU LRU latch “Hot” “Cold” LRU = Least Recently Used MRU = Most Recently Used One LRU Latch protects the linked list during changes to the list
Session Searching for Free Blocks Buffer Headers LRU MRU • Go to the LRU end of data blocks • Look for first non-dirty block • If search too many post DBWR to make free • Free Buffer wait Session Shadow
Free Buffer Wait Solutions • Tune by • Increase data blocks • Try to tune DBWR • ASYNC • If no ASYNC use I/O Slaves (dbwr_io_slaves) • Multiple DBWR (db_writer_processes) • Direct I/O • Tune Inefficient SQL • requesting large # of blocks
Session Finding a Free Block LRU Latch MRU LRU Hot End Mid-Point Insertion Find Free Block Get LRU Latch Insert Header Release LRU Latch session
DBWR taking Dirty Blocks off Buffer Headers LRU LRU MRU latch Dirty List of Buffer Headers LRUW LRU latch also covers DBWR list of dirty blocs DBWR
Cache Buffers LRU Latch LRU MRU Mid-Point Insertion Oracle Tracks the touch count of blocks. As the block is pushed to the LRU end, if it’s touch count is 3 or more, it’s promoted to the MRU end