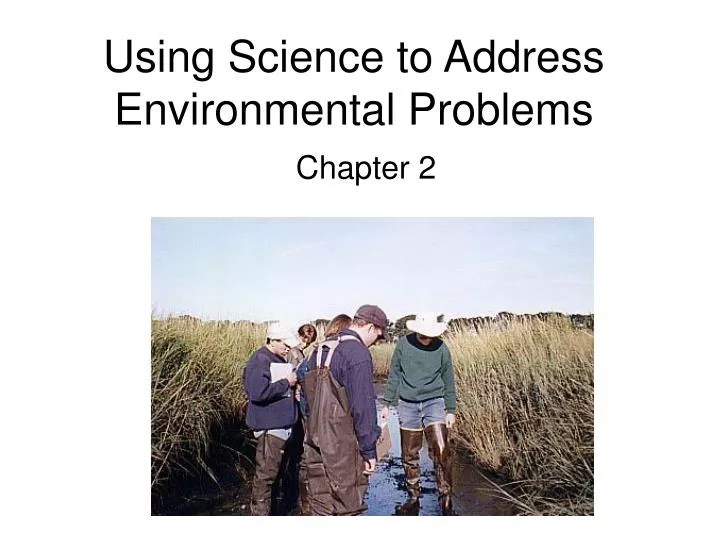

Using Science to Address Environmental Problems
E N D
Presentation Transcript
Problem: Outbreak of Disease Actions that can contribute to outbreaks of infectious diseases are: • Global travel • Social factors • Disruption of Natural Environments • Overcrowded conditions in cities Epidemiologists (people who study the ecology of a disease in a population) are establishing links between human health and human activities
Remote Sensing: A means of acquiring information using airborne equipment and techniques to determine the characteristics of an area. Aerial photographs from aircraft and satellite are the most common form of remote sensing. See pages 22 – 23 in text. Read how epidemiologists used remote sensing to help with malaria problem.
Scientific Method • Define problem: Establish question to be investigated and research the problem • Form a hypothesis • Test the hypothesis: set up and perform an experiment. • Analyze and interpret data collected to form a conclusion • Communicate your results.
Reasoning Scientists use reasoning to discover general principles. Two types: *Inductive reasoning – seeks unifying explanation for the data. Goes from specific to general. *Deductive reasoning – makes relationships among data more apparent. Goes from general to specific.
Theory • Can be used to predict the existence of as-yet unobserved things or phenomena. • An integrated explanation of numerous hypotheses • Example: Cell Theory
Risk • The probability of injury, disease, death, or environmental damage under a given set o circumstances. • Risk = 0, no risk Risk = 1, high risk • In 2002, the population of the US was approximately 283 million. If the American Cancer Society concluded that 170,000 people who smoked died of lung cancer, what is the probability of a US citizen dying of lung cancer? 0.006
Risk Assessment Includes the following: • Identification of the hazard • Dose-response assessment • Assessment of the exposure • Characterization of the risk
Toxicity • Acute: produces an effect within a short period of a single exposure. Effects range from dizziness and nausea to death and can occur immediately or within several days • Chronic: generally produces damage to vital organs, such as kidneys or liver, following long-term, low-level exposure to the chemical. Insecticides used by Saginaw Co., Minnesota
Lethal Dose • LD50:What dose is lethal to 50% of a population of test organisms • The smaller the LD50, the more lethal the substance • The LD50 values are lower for children than adults.
How much caffeine would it take to kill 50% of people weighing 68 kg (150 lbs.)? • By means of comparison, a 7 oz cup of coffee has the following caffeine (mg) amounts: • Drip 115-175 • Espresso 100mg of caffeine 1 serving (1.5-2oz) • Brewed 80-135 Instant 65-100 • Decaf, brewed 3-4 • Decaf, instant 2-3 • Tea, iced (12 ozs.) 70 • Tea, brewed, imported 60 • Tea, brewed, U.S. 40 • Tea, instant 30 Approximately 90 cups of Drip coffee.
Dose Response Curve Shows the effect of different does on a population of test organisms. Threshold level: the maximum dose that has no measurable effect on the organisms. ED50/LD50 – Effective dose 50/Lethal dose 50 = the dose that causes 50% of a population to exhibit whatever response is under study
Carcinogens: Any substance known to cause cancer • Cancer was traditionally the only disease evaluated in the chemical risk assessment of environmental contaminants • Rats and mice often respond differently to the same toxicant • It is assumed that one can extrapolate from doses and cancer rates in rates to determine human cancer rates. • The body often handles very small doses of carcinogens differently than very large doses. • These are usually studied in very large doses.
Risk Assessment of Chemical Mixtures Chemical mixtures can interact by: • Additivity – the effect is exactly what one would expect • Synergistic – has a greater combined effect than would be expected • Antagonistic – has a smaller combined effect than would be expected
Precautionary Principle • When a technology or chemical product is suspected of threatening human health or the environment, precautionary measures should be taken even if there is scientific uncertainty about the scope of danger. • See text, page 30, right side, Christine Todd Whitman quote.