Download
1 / 61
610 likes | 639 Vues
Explore GIS constructs, spatial analysis examples, and applications in public health. Learn basic theory, projections, overlays, geocoding and mapping techniques.

E N D
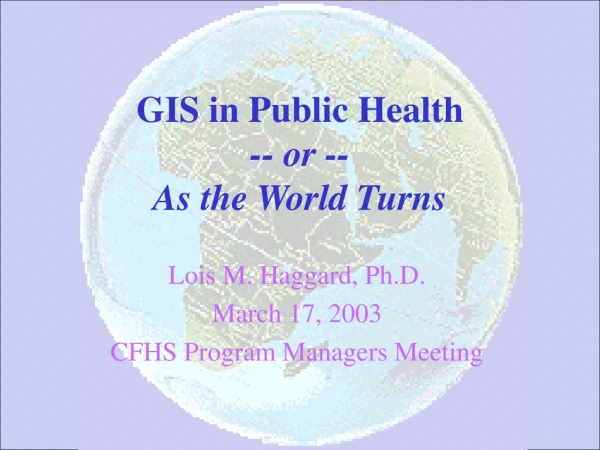
GIS in Public Health-- or --As the World Turns Lois M. Haggard, Ph.D. March 17, 2003 CFHS Program Managers Meeting
Outline • Brief review of GIS constructs • Spatial analysis and public health examples • “How to” - local resources for mapping your data
Disclaimer • I am not a GIS specialist • I learned much of what I know in preparation for this presentation! • I am glad to share what I have learned, and we can go forward together.
Basic Theory and Constructs • GIS Defined: • A Geographic Information System consists of all the computer hardware, software, personnel and data that are required to map and analyze spatial data. • A popular GIS software provider is ESRI (Environmental Systems Research Institute). They produce ArcView (desktop version), ArcIMS (for Internet applications), and ArcExplorer (freeware), among others.
Basic Theory and Constructs • GIS versus GPS • GIS is not GPS - but GPS is used by GIS • GPS stands for “Global Positioning System,” which is a system of satellites circling the Earth, and the devices that interpret the data from those satellites, providing coordinates on the Earth’s surface. (GPS “Geocodes” your position on the Earth’s surface.)
Basic Theory and Constructs • Purpose of GIS in Public Health • Descriptive epidemiology - • Person • Place • Time • Maps used in public health generally depict how events that happened to persons during a particular time window are distributed over geographic space. • CDC URL for GIS in public health -- http://www.cdc.gov/nchs/gis.htm
Basic Theory and Constructs • Purpose of GIS in Public Health • Disease and injury events have spatial associations we may want to be aware of. • Infectious diseases spread from person to person • Environmental exposures (e.g., cancer downwind from nuclear testing) • Heath care utilization is related to proximity to facilities • Lifestyle factors can be related to environment • Health status is related to other social factors (e.g., income, education) that are spatially related.
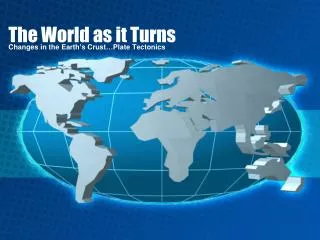
The “Global” Perspective -NEWS FLASH- Earth Not Flat! -- But maps ARE -- • A location on the Earth is communicated in latitude and longitude. • A location on a map is communicated using Cartesian coordinates (x, y, & sometimes z)
Projections and Distortion • Map projections project the Earth's surface onto a flat plane. • There are numerous types of projection, each of which distorts some parameter of the Earth's surface be it distance, area, shape, or direction. • Projection decisions always represent tradeoffs between different types of distortion and convenience.
Spatial Analysis • Geocoding • Definition: Transforming a location on the Earth’s surface into x and y coordinates so it may be represented on a map. • Common example: Geocoding addresses - What are the x and y coordinates for our address: 288 North 1460 West? • Which projection?
9 10 8 7 6 4 5 3 1 2 Spatial Analysis • Overlays
Spatial Analysis • “Themes” • Definition: A feature, layer or phenomenon represented on a map. • Examples: • brain cancer • census tract boundaries • pollution plume • city streets • water systems in London in 1856
Spatial Analysis • “Themes” (cont’d) • Cancer Examples: • cancer screening • cancer incidence • cancer cases detected at late stage • cancer survival • cancer mortality
Spatial Analysis • “Attributes” • Definition: Characteristics of the feature being mapped. • Examples: • street starts at point x1, y1 and travels to point x2, y2 • color is blue • name labels • death rate (for polygon) is 78.2 • contour lines represent 250 vertical feet elevation • contour lines represent logarythmic increases/decreases in disease rate
Spatial Analysis • Types of Maps • Isopleth (points and contours, raster) • Clusters • Raster algebra, kriging • Public health applications
Clinton/Sunset TCE Plume With Shifted Cancer Cases and Ownership Polygons
Spatial Analysis • Isopleth Pros and Cons • Pros • You can get more precise view of phenomenon • Cons • You need more complex “raster algebra” to compute rates
Spatial Analysis • Types of Maps • Chloropleth (polygons, vector-based) • Common ploygons (county, LHD, census tract, ZIP code) • Boundaries, Centroids • Public health applications
node vector population centroid geographic centroid Spatial Analysis • A polygon is a many-sided geometric shape. GIS software records it as a series of nodes and vectors. Together the nodes and vectors are called a “shape file.”
Percentage of Births That Were Born to Adolescent Mothers by Whether the Rate Was Higher, Lower, or Not Different (Statistically) from the State Rate. Utah, 1994-96. Percentage for a small areas was considered different from the state rate if its 95% confidence interval did not include the state rate. Small area designation was based on residence of mother. Data Source: Utah Department of Health, Bureau of Vital Records.
Spatial Analysis • Chloropleth Pros and Cons • Pros • Computation of rates is simple (providing you have population denominators for areas) • Cons • Not as precise a view • The smaller the area, the more spatial information, but we’re limited by sparse data and lack of population data that matches numerator data. • A cluster could lap two areas or appear in a populated area and be “washed out” by the large population.
A Geographic Information Analysis ofUrban Infant Mortality Rates Gerard Rushton 1 , Diane Krishnamurti 2 , Rajesh Krishnamurthy 1 and Hu Song 3 1. Department of Geography, The University of Iowa, Iowa City, Iowa 52242 2. Iowa Birth Defects Registry, The University of Iowa, Iowa City, Iowa 52242 3. Iowa Department of Public Health, Des Moines, Iowa 52319 http://www.uiowa.edu/~geog/health/
New York City Maps • I was just in NYC, and saw these maps. I think I’ll copy some ideas for IBIS...
On Your Mark, Get Set... • Software • ArcView 8.2 • Runs on Windows NT, 2000, XP • $1,500 for a single-user, stand-alone license (UDOH has it on the network. You still need a license, but I’m not sure about the cost.) • URL for ArcView and other ESRI products: http://www.esri.com/ • There are other software providers, but ArcView is the product we’ve always used in OPHA.
On Your Mark, Get Set... • Data to Represent Themes • Geocoded themes of interest (e.g., births, residence of persons with a given disease) • Shape files • Overlays - Many available through the state’s Automated Geographic Resource Center (AGRC) at maps.utah.gov