Objectives of the project
910 likes | 1.07k Vues
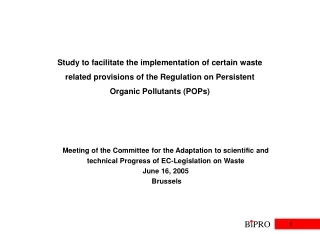
Study to facilitate the implementation of certain waste related provisions of the Regulation on Persistent Organic Pollutants (POPs). Meeting of the Committee for the Adaptation to scientific and technical Progress of EC-Legislation on Waste June 16, 2005 Brussels. Objectives of the project.

Objectives of the project
E N D
Presentation Transcript
Study to facilitate the implementation of certain waste related provisions of the Regulation on Persistent Organic Pollutants (POPs) Meeting of the Committee for the Adaptation to scientific and technical Progress of EC-Legislation on Waste June 16, 2005 Brussels
Objectives of the project POPs Regulation 2004/850/EC information and decision basis to facilitate the implementation • occurrence of POPs in waste: compilation and evaluation of existing data • proposal for concentration limits: methodology and recommendations • environmental preferability: methodology and case studies • proposal for reference measurement methods
Information sources extensive questionnaire thanks for more than 100 answers • conferences • personal meetings • visits of plants • telephone and e-mail discussion • already available studies and data, statistics, literature, BREF documents, internet • stakeholder workshop • internet discussion on draft final report
Differentiated approach for waste and pollutant flows waste volume limit value • Two types of important information: • Quantities of pollutants formed and released • Volumes and structure of contaminatedwastes to be managed Separate mass flows are established for • PCDD/Fs • PCB • POP pesticides • other POPs: HCB, HCH, HxBB
Topic 2 European mass flow for POPs with a specific focus on waste PCDD/PCDF PCB POP pesticides other POPs
Mass flow results for dioxins: The overall flow of PCCD/Fs Based on average concentrations the overall flow of PCDD/F to waste and products totals 21 kg/year.
Mass flow results for dioxins: An overview on sources Anthropogenic discharge From activities: ~ 17.5 kg/y Recycling: 3.4 kg/y Sources 20,900 g/year MSWI: ~ 1,999 g/y Sewage sludge: 297 g/y Fe sintering: 1,400 g/y HWI: 78 g/y Compost: 160 g/y EAF: 1,401 g/y Hospital WI: 143 g/y Road traffic: 56 g/y Fe smelting: 143 g/y PP coal: 1,651 g/y Domestic burn: 3,656g/y Secondary Cu: 226 g/y PP biomass: 606 g/y MSW: 8,404 g/y Secondary Al: 500 g/y EDC production: 13 g/y 336 g/y Secondary Zn: 181 g/y
Mass flow results for dioxins: An overview on endpoints Anthropogenic discharge From activities: ~ 17.5 kg/year Emissions: 4.2 kg/year Recycling / recovery 3,400 g/year Waste 16,350 g/year Waste for disposal: 13.3 kg/y Hazard. waste incineration ~200 g/year Landfill for non haz. waste 7,125 g/year Landfill for hazard. waste* 2,197 g/year Temporary storage 92 g/year Non haz. waste incineration 1,741 g/year Landfill for inert waste 273 g/year Landfill for hazard. or non haz. waste** 1,780 g/year
Dioxin waste flow: Means and ranges of contamination in different waste types
Dioxin waste flows: A detailed view on selected waste streamsExample: EAF 0 10 1224 0 616 557 61 0 Metals, scrap m=69.5 Mt c= negligible Slag m=10 Mt c=0.001 ng TEQ/g(0.0002-0.003) Filter dust m= 1.1 Mt c= 1.1 ng TEQ/g(0.1 - 10) Refractory bricks m= x c= 0 ng TEQ/g Landfill m= x c=0 ng TEQ/g Sold, used and recycled m= 5.6 Mt c= 0.11 ng TEQ/g Hazardous or non hazardous landfill m= 5 Mt c= 0.11 ng TEQ/g Temporary storage m= 0.5 Mt c= 0.11 ng TEQ/g in g PCDD/F TEQ/y
Correlation of Low POP content Limit and Waste Quantities: Dioxins quantity POP waste[kt] 2,800 450 300 limit value 100 1 ppb 5 ppb 10 ppb 15 ppb
Mass Flow results for PCBs: The overall flow of PCBs Based on average concentrations waste flows contain a total PCB load of 5,600 tons/year.
Mass Flow Details on PCB: An overview on sources and endpoints WEEE: 5,210 t/year waste oil: 14.9 t/year sewage sludge: 4.8 t/year Demolition: <1000 t/year Shredder: 18 t/year compost: 4.5 t/year Sources 6,252 t/year Emission 626 t/year Product 4.5 t/year Waste 5,626 t/year 4.5 t/year landfillinginert 300 t/year landfillingnon-hazardous ~ 11.75 t/year landfilling hazardous/ underground storage 303.5 t/year Incineration 4.35 t/year Incineration hazardous 4,991 t/year Energy recovery 3.15 t/year Substance recovery 10 t/year
Correlation of Low POP content Limit Waste Quantities : PCB quantity POP waste [kt] • construction and demolition waste is not included in the figure becausePCB contamination 1 ppm is already regulated • excavated soil is not considered due to missing data 6,700 2,900 800 470 100 1 ppm 5 ppm 10 ppm 20 ppm 50 ppm
Mass Flow results for POP pesticides: The overall flow of POP pesticides Based on average concentrations waste flows contain a total POP load of 537 tons/year.
Mass Flow results for other POPs: The overall flow of other POPs Based on average concentrations waste flows contain a total POP load of 3,500 tons/year.
Topic 3 Methods for establishment of limit values and corresponding suggestions Annex IV
Assessment Methodologies and their Outcome: Overview Method 2for decision on environmental preferability maximum limit (Annex V) low POP content limit (Annex IV) Concentrationof POP in waste xxxxxxx IIIIIIIIIIIIIIIIIIII //////////////////////////////////////////////// POP wastePOP content to be irreversibly destroyed POP wastedisposal operation may depend on environmental preferability (annex V) NoPOPwaste99/31/EC Method 1 for assessment ofmaximum limit Method 1 for assessment of low POP content limit Proposals for low POP content limits for different POPs (Annex IV) Proposals for maximum limits for different POPs (Annex V) exemplary application for important cases
Method 1 related to Annex IV: Basic Principle Concentrationof POP in waste Upper limitation criteria for determining limit values (Limit value has to be below) Lower limitation criteria for determining limit values (Limit value may not be below ) Range for suggestion of limit value
Method 1: Lower Limitation Criteria for Low POP content Limit A Analytical potential B Environmental background contamination C Disposal capacities D Economic feasibility
Method 1: Upper Limitation Criteria Z Existing limit values already agreed by European Union Y unacceptable risks to human health and the environment X Precautionary principle
Target Function for Range Reduction "Reduce results for different waste matrices to the most unfavourable waste matrix" target function result after application of target function 0.01 ppb 0.05 ppb 0.1 ppb Analytical sensitivity in different waste matrices
Target function II (Precautionary principle) "Each party shall …take …measures to reduce the total releases…with the goal of their continuing minimization and, where feasible, ultimate elimination " (Stockholm Convention Article 5-7) target function range result after application of target function
Results for Criterion A: Analytical potential Dioxins: 0.1 ppb for PCDD/PCDF-TEQ PCBs: 1 ppm individual congener 30 ppm total PCB (based on Σ 6 cong. x 5) POP pesticides: 1 ppm other POPs: 1 ppm
Criterion A: Analytical Potential for Dioxin Measurements Cost (relative) Standard LimitationCrit. A Cost for dioxin measurement in most unfavourable matrix 2.0 1.5 1.0 Dioxin concentrationdetected (TEQ) 0.01 ppb 0.1 ppb 1.0 ppb 10 ppb Detection method: HRGC/HRMS
Modelled mean contamination levels for soil in European countries ( EMEP data base )
Results for Criterion C: Disposal Capacities * based on available data
Criterion C: Disposal Capacities“Low POP content limits should be realistic against the background of disposal capacities” Material flows Scenario for low limit value Needed quantities Continue with higher limit value Comparison to available capacities (Transport, disposal, administration) NO Assessment of possibility and time frame to build up sufficient capacities Realistic? YES Use as lower limitation criterion
Correlation of Low POP content Limit and Waste Quantities: Dioxins quantity POP waste[kt] 2,800 450 300 limit value 100 1 ppb 5 ppb 10 ppb 15 ppb
Results for Criterion D: Economic Feasibility Feasible limit values: Dioxins (TEQ): 10 ppb PCB: 30 ppm* POP pesticides: 1 ppm other POPs: 1 ppm * total PCB in terms of Σ 6 Cong. x 5
Criterion D: Economic feasibility“Low POP content Limits have to be in accordance with economic feasibility” Material flows Scenario for low limit value Consequences for POP waste quantities Continue with higher limit value Monetary impacts compared to status quo NO Feasibility against economic parameters Feasible? YES Use as lower limitation criterion
Correlation of Low POP content Limit and Waste Quantities: Dioxins
Examples for important economic impacts due todioxin Low POP contents Limits (5, 10, 15 ppb) • Recovery of aluminium filter dust • limit value of 5 ppb would reduce recovery potential significantly(around 10,000 t estimated) minimum additional costs 2 mio. € expected • limit value of 10 ppb and 15 ppb would have only smaller impacts(around 2,000 t estimated) • Recovery of fly ash in asphalt • limit value of 5 ppb would reduce recovery potential significantly(around 100,000 t estimated) • limit value of 10 ppb and 15 ppb would have only smaller impacts (around 10,000 t and 2,000 t estimated) conclusion: economic feasibility at a Low POP content Limit of 10 ppb
Correlation of Low POP content Limit and Quantities of POP Waste: PCB
Examples for important economic impactsdue to PCB Low POP contents Limits of 10, 30, 50 ppm • Shredder residues • recycling of cables will be more difficult as part of shredder material will become POP waste: • For a limit value of 10 ppm up to 200,000 t are concerned, for limit values of 30 ppm or 50 ppm these amounts are significant lower (~ 25,000 t). • Construction and demolition waste • significant amounts of waste will become POP waste, however already existing regulation sets up 1 ppm limit value for inert waste disposal conclusion: economic feasibility at a Low POP content Limit of 30 ppm
Low POP content Limit: Overall result of the lower limitation criteria dioxins c 0.01 ppb 0.1 ppb 5 ppb 10 ppb Criterion B A C D PCBs c 5 ppm 10 ppm 30 ppm Criterion C B A and C POP pesticides c 1 ppm 10 ppm Criterion A B no limitations by C and D other POPs c 1 ppm 10 ppm Criterion A B no limitations by C and D
Results for Criterion Z: Existing Limit Values"Low POP content limits should not exceed already existing international/ community agreed limits" Dioxins: 15 ppb PCB: 50 ppm POP pesticides: 50 ppm other POPs: 50 ppm Source:Basel Convention General technical Guideline on ESM of POP wastes (final); Technical Guidelines on ESM of PCB/PCTs (final)* *adopted by COP 7 under the Basel Convention, Geneva 2004
Results for criterion Y: unacceptable risk to human health"Low POP content limit have to exclude unacceptable risks" Levels, for which unacceptable risks can be excluded: Dioxins: 1 or 15 ppb (depending on restrictions for disposal routes) PCB: 50 ppm POP pesticides: 50 ppm other POPs: 50 ppm That means, the already agreed limit values (Basel Convention) enable the exclusion of unacceptable risks to health and the environment for PCBs, POP pesticides and other POPs. This does not mean, that all risks can be excluded at these levels.
Risk assessment All waste flows of the analysed POP waste flows have been checked on most critical but realistic ways of disposal. POP relevant material flows disposal paths evaluation on critical exposure risk Ranking Result: The most critical disposal/recovery path is use of contaminated material placed directly onto or mixed with soil e.g. as fertilizer, sidewalk pavement.
Contaminated material placed directly onto or mixed with soil Atmospheric deposition Exposure viafood chain absorption/ingestion from upper soil layers directexposure slow diffusion /low transfer rates for hydrophobic, lipophilic substances between soil layers
Assessment of critical paths tolerable PCCD/F level in eggs: 3 pg TEQ/g fat* uncertainty factor: 10 (following risk assessment) level where unacceptable risks can not be excluded: 30 pg/g fat assumption: 0.9 ppb contaminated material elevation by 7.5 pg/g fat in eggs 4 ppb contaminated material elevation > 30 pg/g fat in eggs unacceptable risks can not be excluded by 4 ppb Low POP content limit * 2001/2375/EC
Consequences of assessment Result: Low POP content limit of 1- 3 ppb for dioxin contamination of waste would be necessary to exclude unacceptable risks Result fits to several limit values for soil and related material (1 ppb)
Risk and exposure assessment for Total PCB EPA risk and exposure assessment of PCBs "Use, processing and distribution in commerce of products with less than 50 ppm PCB concentration will not generally present an unreasonable risk of harm or injury to health or the environment"[53 Federal Register No 123, 24206, June 27, 1988]
Transmission of Risk Assessment for PCB, POP pesticides and other POPs Following toxicological attributes of POP pesticides and other POPs, the POPs carrying medium and the potential to enter the food chain there are similarities between PCBs, POP pesticides and other POPs. Therefore the risk assessment results can be assigned. Consequently unacceptable risks can be excluded for the following Low POP content Limit values: PCB: 50 ppm POP pesticides: 50 ppm other POPs: 50 ppm
Overall result for method 1: Low POP content limit PCB Criterion X Concentration of PCB in waste 5 10 30 50 ppm ppm ppm ppm Criterion Criterion Criteria Criterion C B A,D Z, Y option 1 option 2 Proposal for Low POP content limit
Overall result for method 1: Low POP content limit POP pesticides Criterion X Concentration of POP pesticides in waste 1 10 50 ppm ppm ppm Criterion Criteria Criterion A B Z, Y option 1 option 2 Proposal for Low POP content limit
Overall result for method 1: Low POP content limit other POPs Criterion X Concentration of other POPs in waste 1 10 50 ppm ppm ppm Criterion Criterion Criterion A B Z, Y option 1 option 2 Proposal for Low POP content limit
Overall result for method 1: Low POP content limitPCDD/PCDF (Standard procedure) Criterion X Concentrationof dioxins in waste 15ppb 0.1/0.01ppb 5ppb 1ppb 10ppb ? CriterionA, B CriterionD CriterionC CriterionZ CriteriaY problems to suggest low POP content limit