Download
1 / 14
140 likes | 278 Vues
U.S. Influenza Surveillance 2003-2004. Ann Moen Influenza Branch NCID/CDC. U.S. Influenza Surveillance. State and Territorial Epidemiologists. Sentinel Providers. Vital Statistics Registrars. Health Departments. CDC. Laboratories. Other. Public Health Officials. Public.

E N D
U.S. Influenza Surveillance2003-2004 Ann Moen Influenza Branch NCID/CDC
U.S. Influenza Surveillance State and Territorial Epidemiologists Sentinel Providers Vital Statistics Registrars HealthDepartments CDC Laboratories Other Public Health Officials Public Physicians Media
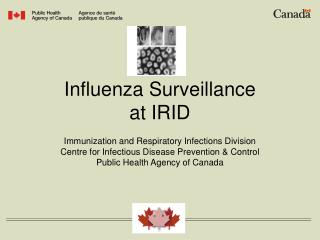
WHO/NREVSS Collaborating LaboratoriesNational Summary, 2003-04
The Viruses: 2003-04 Influenza Season Week ending February 7, 2004- week 5 • Total specimens tested by WHO and NREVSS laboratories in the U.S. = 92,159 • Total positive for influenza = 22,419 (24.3%) • Influenza A = 22,286 (99.4%) Influenza B = 133 • Total subtyped = 5,862 (26.3%) • A(H3N2)= 5,861 (99.9%) and A(H1)=1 • Subset characterized at CDC
Percentage of Specimens Testing Positive for Influenza National Summary, 2003-04
Percentage of Visits for Influenza-like IllnessReported by Sentinel ProvidersNational Summary, 2003-04
U.S. Sentinel Providers ReportingSummary as of February 13, 2004 • 1931 SPs enrolled • 1141 regularly reporting • 19,727 reports received (19 weeks) • 5,581,022 patient visits recorded • 169,919 reports of ILI
Pneumonia and Influenza Mortality for 122 U.S. CitiesWeek Ending 02/07/04 EpidemicThreshold SeasonalBaseline 2000 2001 2003 2002 10 20 30 40 50 10 20 30 40 50 10 20 30 40 50 10 20 30 40 50
Weekly Influenza Activity Estimates Reported by State & Territorial Epidemiologists Week ending October 4, 2003 - Week 40 No Report No Activity Sporadic Local Activity Regional Widespread
Previous Years 4 levels of activity None, sporadic, regional, widespread Based on percentage of population & counties Criteria used either outbreaks of culture confirmed influenza or ILI 2003-2004 5 levels of activity None, sporadic, local, regional, widespread Based on state defined regions Defined criteria uses combination of ILI/outbreaks and laboratory data Specified time frames for lab confirmation Changes in Activity Reports from State & Territorial Epidemiologists
Weekly Influenza Activity Estimates Reported by State & Territorial Epidemiologists Week ending December 20, 2003 - Week 51 No Report No Activity Sporadic Local Activity Regional Widespread
No Activity Sporadic Regional Widespread No Report Peak of Influenza Activity as Reported by State & Territorial Epidemiologists – 1999-2000 Season Week ending January 15, 2000 - Week 2
No Activity Sporadic Regional Widespread No Report Peak of Influenza Activity as Reported by State & Territorial Epidemiologists – 2002-03 Season Week ending March 1, 2003 - Week 9