Growth of the Hispanic Population in the United States: 1970 to 2050 Projections
This report offers an extensive analysis of the growth of the Hispanic population in the United States from 1970 to projected figures for 2050. It highlights key census data, showcasing a remarkable increase in the Hispanic demographic, which grew by 43% between 2000 and 2010 alone. The data reveals contributions from various Hispanic nationalities and notes shifts in birth rates. Significant insights include the states with the largest Hispanic populations and growth trends in specific counties, emphasizing the evolving racial landscape in the U.S.

Growth of the Hispanic Population in the United States: 1970 to 2050 Projections
E N D
Presentation Transcript
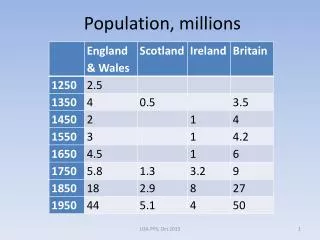
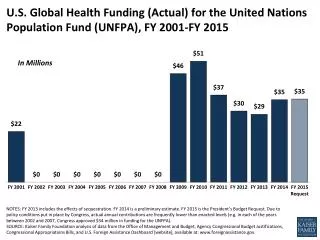
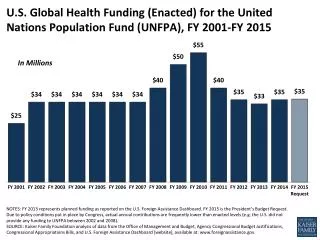
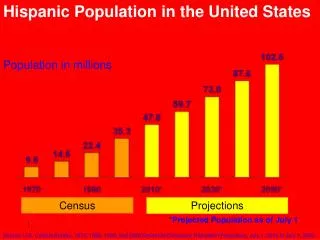
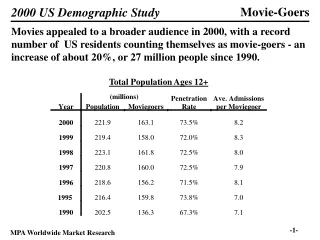
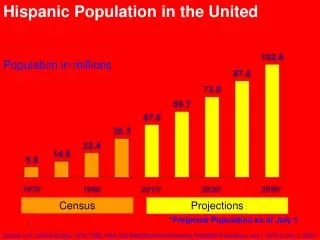
Hispanic Population in the United States: 1970 to 2050 Population in millions Census Projections *Projected Population as of July 1 Source: U.S. Census Bureau, 1970, 1980, 1990, and 2000 Decennial Censuses; Population Projections, July 1, 2010 to July 1, 2050
U.S. Population, by Race and Ethnicity, 2010 and 2000 (thousands) 2010 2000 Hispanic 50,478 [43.0%]* 35,306 White 196,818 [1.2%] 194,553 Black 37,686 [11.0%] 33,948 Asian 14,465 [42.9%] 10,123 American Indian/Alaska Native 2,247 [8.6%] 2,069 Native Hawaiian/Pacific Islander 482 [36.2%] 354 Some other race 604 [29.1%] 468 Two or more races 5,966 [29.6%] 4,602 *--Percentage growth in decade Notes: Racial groups include only non-Hispanics. Hispanics are of any race. Source: Pew Hispanic Center tabulations of U.S. Census Bureau Redistricting_Files-PL_94-171 for states PEW HISPANIC CENTER, March 24, 2011
US Latinos, 2010 Census --there were 50.3 million in US, [In 1990, pop. was 22.4 & in 2000 it was 35.2] --represent 16.3% of the nation’s pop. --Latino pop. grew by 43% in decade --since 2000, total pop. of country grew by 27.3 mil. & Latinos were 15.1 mil., or 55.3% of the total country’s growth Source: US Census , June 2011
US Latinos--2011 --Between April ’10, & July ‘11, US pop. grew by 2.8 million, 0.7% per year and smallest percentage increase since 1945 --Births rates among Hispanics, …declined by 17% from 2007 to 2010 [3.8% for Whites and 6.7% for Blacks]. --Rates dropped most sharply among young Hispanics, down by 23 percent for women 20 to 24 between 2007 and 2010. Source: NewYork Times, Dec. 22, ’11
U.S. Hispanic Population Growth, by Country of Origin, 2000-2010 POPULATIONGROWTH 2010 2000 Number % All Hispanics 50,478 35,306 15,172 43.0% Guatemalan 1,044 372 672 180.3 Salvadoran 1,649 655 994 151.7 Colombian 909 471 438 93.1 Dominican 1,415 765 650 84.9 Mexican 31,798 20,641 11,158 54.1 Cuban 1,786 1,242 544 43.8 Puerto Rican 4,624 3,406 1,218 35.7 Notes: Hispanic population growth among country of origin groups with a population of 900,000 or more in 2010. Growth rates are computed from unrounded data. Source: 2010 Census and 2000 Census (Ennis, Ríos-Vargas and Albert, 2011) PEW HISPANIC CENTER
Hispanic Child and Adult Populations, 2010 and 2000 ALL CHILDREN ADULTS Hispanic Population (thousands) 2010 50,478 17,132 33,346 2000 35,306 12,342 22,964 Hispanic Population Growth, 2000-2010 Growth (thousands) 15,172 4,790 10,382 Growth (%) 43.0 % 38.8% 45.2 % Hispanic Share of Total (%) 2010 16.3% 23.1% 14.2% 2000 12.5% 17.1 % 11.0 % Notes: Children are those younger than 18; Adults are those 18 years of age or older. Source: Pew Hispanic Center tabulations of U.S. Census Bureau Redistricting_Files-PL_94-171 for states PEW HISPANIC CENTER , March 24, 2011
States with Largest Hispanic Populations, 2010 (thousands) STATE POPULATION California 14,014 Texas 9,461 23,475*[46.5%]** Florida 4,224 New York 3,417 Illinois 2,028 33,144[65.7%] Arizona 1,895 New Jersey 1,555 Colorado 1,039 New Mexico 953 38,586[76.4%] Georgia 854 North Carolina 800 Washington 756 40,996[81.2%] *--Cummulative totals **--Cummulative percent Source: Pew Hispanic Center tabulations of U.S. Census Bureau Redistricting_Files-PL_94-171 for states PEW HISPANIC CENTER , March 24, 2011
US Latinos–2000 to 2010 --Texas grew by more than four million people in the last decade, with about 65 percent of the growth coming in the Hispanic population. Source: New York Times, Jan. 21, ’12
States with Largest Hispanic Population Growth, 2000-2010 (%) STATE GROWTH, 2000-2010 South Carolina 148 % Alabama 145 Tennessee 134 Kentucky 122 Arkansas 114 North Carolina 111 Maryland 106 Mississippi 106 South Dakota 103 Delaware 96 Georgia 96 Virginia 92 Source: Pew Hispanic Center tabulations of U.S. Census Bureau Redistricting_Files-PL_94-171 for states PEW HISPANIC CENTER, March 24, 2011
US Latinos, Counties, 2010 Census --Los Angeles = 4.7 million --Harris = 1.7 million --Miami-Dade = 1.6 million --Cook = 1.2 million --Maricopa = 1.1 million Source: US Hispanic population:2010, US Census, May, 2011
US Latinos, Counties, 2010 Census --Orange = 1.0 million --Bexar = 1.0 million --San Bernandino = 1.0 million --Top Eight Counties = 13.3 [26.3%] Source: US Hispanic population:2010, US Census, May, 2011
States with Largest Hispanic Share of Total Population, 2010 (%) STATE HISPANIC SHARE New Mexico *[5] 46.3% Texas 37.6 California 37.6 Arizona [11] 29.6 Nevada [6] 26.5 Florida [29] 22.5 Colorado [9] 20.7 New Jersey 17.7 New York 17.6 Illinois 15.8 Connecticut 13.4 Utah 13.0 *--Considered `swing’ states in presidential elections, have a total of 60 Electoral College votes Source: Pew Hispanic Center tabulations of U.S. Census Bureau Redistricting_Files-PL_94-171 for states PEW HISPANIC CENTER, March 24, 2011
Wisconsin Hispanics, 2010 --Total State Pop. in 2010 = 5.712 million --Hispanic Pop. In 2010 = 348,432, 6.1% of state’s population --WI Latinos represent 0.7% of US Latino pop., 24th in country --66% of WI Latinos are Native-Born --79% of WI Hispanics are of Mexican heritage --Median age of WI Latinos is 25-yrs….16 for Native-born and 35 for foreign-born,non-Hispanic whites = 41-yrs Source: US Census, State & County Quick Facts, August, 2012
Wisconsin Hispanics, 2010 Between 2000 and 2010, WI’s pop. grew by 348,000 [6.49%] and of those, 98,389 were Hispanics, representing 28.3% of the total growth. The Hispanic population grew by 39.4%, more than six-times the rate of the entire state. Source: US Census, July 9. 2011
--Percent of WI Latinos that are 9-yrs or younger is 24.8% --Percent of WI Latinos that are 19-yrs or younger is 42.9%
WI County Hispanic Pop., ‘10 --Milwaukee = 129,544 13.6% 37.1% --Dane = 30,253 6.1 8.7 --Racine = 22,860 11.7 6.5 --Kenosha = 20,075 12.0 5.7 --Brown = 18,856 7.5 5.4 --Waukesha = 16,801 4.3 4.8 --Rock = 12,487 7.8 3.6 --Walworth = 10,808 10.5 3.4 --Outagamie = 6,761 3.8 1.9 --Sheboygan = 6,448 5.6 1.8 TOTALS = 349,310 78.9% Source: US census
Milwaukee Hispanics, 2010 --Milwaukee Co Pop. Estimate is 952,532 --Milwaukee Co. Hispanic Pop. is 129,544, representing 13.6% of county’s pop. --From 2000 to 2010, Milwaukee Co. pop. grew by only 12,368, while Latino pop. grew by 47,138—e.g. without Latino pop., county would have declined in pop…Latino pop. grew by 57.2% --Between 1990 and 2000, Milwaukee Co. pop. declined by 19,000, while Latino pop. grew by 37, 700 Source: US Census, July 9, 2010
Latinos and The Census Is it Race or Ethnicity? 1960 1970 1980 1990 2000 Race (one-race); No Data Collected for Latinos Race (one-race); Spanish Origin Yes or No Race (one-race); Spanish/Hispanic Origin Mex/PR/Cuban/Other Race (one-race); Hispanic Origin Mex/PR/Cuban/Fill-in-the-Blank Race (multi-race); Hispanic/Latino Mex/PR/Cuban/Fill-in-the-Blank “Latinos Can be of Any Race”
American White Black Indian Asian Other 2+ Races United States 16,839,535 654,510 356,783 140,046 14,989,372 2,258,185 47.8% 1.9% 1.0% 0.4% 42.5% 6.4% Wisconsin 85,904 3,506 3,575 717 81,428 15,919 45.0% 1.8% 1.9% 0.4% 42.6% 8.3% Latinos Challenge the American Racial Paradigm Almost Half of Latinos Do Not Define Themselves in Classic American Racial Terms
US Latinos--Declining Status --”Over the past two decades, Hispanics have moved from the middle of the socioeconomic hierarchy, between blacks and whites, to a position below both. On virtually every indicator of socioeconomic welfare, Hispanics fell relative to blacks.” Source: Massey, Douglas,Ss., “Isolated, Vulnerable And Broke”, Op-Ed., New York Times, August 5, 2011