Download
1 / 24
240 likes | 399 Vues
INTERNATIONAL PHD PROJECTS IN APPLIED NUCLEAR PHYSICS AND INNOVATIVE TECHNOLOGIES This project is supported by the Foundation for Polish Science – MPD program, co-financed by the European Union within the European Regional Development Fund.

E N D
INTERNATIONAL PHD PROJECTS IN APPLIED NUCLEAR PHYSICS AND INNOVATIVE TECHNOLOGIES This project is supported by the Foundation for Polish Science – MPD program, co-financed by the European Union within the European Regional Development Fund Calibration of a Modular Straw-Tube-Tracker for the COSY-TOF Experiment Sedigheh Jowzaee 3-6 June 2013, Symposium on Applied Nuclear Physics and Innovative Technologies, Krakow, Poland
Outline • COSY facility & COSY-TOF Spectrometer • COSY-TOF Straw-Tube-Tracker (STT) • STT calibration goal • Calibration approach • Apply Corrections • Find R-T correlation
COSY facility • COSY: Cooler Synchrotron • Polarized and unpolarized beams of protons and deuterons • Momentum range 600 MeV/c to 3.3 GeV/c • medium energy physics program • Cooler & storage ring circumference 184 m • High precision beam by: • electron and stochastic cooling • 4 internal experiment • ANKE, PAX, WASA, EDDA • 2 external experiment • TOF, PANDA test
COSY-TOF Spectrometer 3 m • Strangeness physics
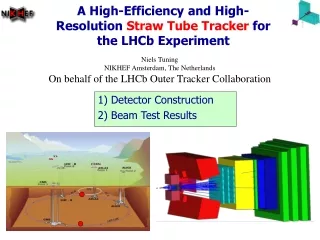
COSY-TOF STT • Installed in vacuum tank • Consists of 2704straw tubes with Ø=10 mm & 1050 mm length • Organized in 13 double-layers • Filled with Ar/CO2 gas at 1.2 bar overpressure • Fixed in 3 orientations with angle 60˚ to each other for 3D track reconstruction
STT readout electronics In the vacuum tank Out of the vacuum tank Time measurement Amplifier-shaper-discriminator chip ASD-8 Preamplifier ASD-8 chip: Short measurement time (10 ns) Good resolution (25 ns) Low operational threshold (2 fC) Shaper with pole-zero cancelation ASD-8 input board: Impedance matching and shaping for ASD-8 chip
STT information • Information from straws Beam hole leading edge trailing edge
Calibration motivation • Reconstruction of events with STT at COSY-TOF • Precise reconstruction of vertices • Reducing background for better resolution • Event analysis based on the vertices reconstruction of the charged final state particles (p, K, Λ p, π) • Precise calibration needed • Different effects should be considered • Multiple hits removal • Signal width cut • Electronics offset correction • Straw layers position correction • pp elastic events measured in Fall 2012 at pbeam=2.95 GeV/c are analyzed for the calibration of the STT
Track Straw Tube e Wire Calibration • Multiple hits removal Using the common-stop readout of the TDCs, higher values correspond to shorter drift times TDC spectrum after removing multiple hits raw TDC spectrum for 5.106 hits in the 2704 single straw tubes
Calibration • Signal width cut • Some noisy hits remain after removing multiple hits • STT electronics readout has a 5ns signal width limit between leading and following trailing edge • Only noise can produce width lower than 5ns • Record leading edge time without trailing edge time • The width spectrum was cut for less than 5ns
Calibration • Signal width cut effect TDC spectrum after a cut on the signal width TDC spectrum before the signal width cut
Calibration • Electronics offset correction • Different readout modules • Correction with fit method • Error function was fitted to the leading edge of TDC spectrum for each straw • χ2/NDF ≤2 • Ref. point=turning point of error function + 1σ • Offset= 780 ns(arbitrary)-Ref. point Turning point complementary error function σ
Calibration • Electronics offset correction • Fit-functions were defined for empty or improper fitted straw tdc spectra
Calibration • Electronics offset correction effect
Drift time • Corrected drift time spectra • Maximum drift time 145 ns • Same drift time spectrum within each double layer • Irregular shape and tail part in first 4double layers • Improper recognition of first hits due to low sensitivity of their electronics • Events mixing and tail pile-up
Self-calibrating method • Main aim: determination of the correlation between the drift time and the isochrone radius • Isochrone radius was calculated for each bins of drift time (homogeneous illumination assumption in whole straw) Ni: no of tracks in t0 to ti Track Straw Tube Isochrone radius: cylinder of closest approach of the particle track to the wire Risochrone Rtube
Distance to track calibration method • Track reconstruction with averaged R-T curve from self-calibrating method • Track parameters were analyzed to find the most probable correlation between TDC time and isochrone radius (track to wire distance) TDC time vs distance to wire for double layer-13 TDC time vs isochrone radius for double layer-13
STT resolution • In Ideal case the R-T curve should be same for all straws • The averaged R-T curve from 3 groups of double layers was used for all straws • Residual=|d| – rd: track to wire distance, r: isochrone radius • Spatial resolution: width of the gaussian+pol4 fit functions to the residual distribution as a function of TDC time • Average resolution at 0.25 cm over all double layers is 142 ± 8 µm Resolution vs isochron radius for double layer-13 TDC time vs residual for double layer-13
Summary • Signal width cut is effective to clean noisy channels • Electronics offset correction was applied well to reduce the systematic error from different electronics modules • For the first time the same Self calibrating R-T curve was used for track reconstruction within each double layer • Improved Average spatial resolution 142 ±8 µm at 0.25 cm over all double layers was found compare to the last calibration with same beam momentum (170 ±11 µm) by taking an average R-T curve • The new calibration improvement is studying with comparison of pp elastic parameters (i.e. vertex resolution) to the former work.
INTERNATIONAL PHD PROJECTS IN APPLIED NUCLEAR PHYSICS AND INNOVATIVE TECHNOLOGIES This project is supported by the Foundation for Polish Science – MPD program, co-financed by the European Union within the European Regional Development Fund Thank You 3-6 June 2013, Symposium on Applied Nuclear Physics and Innovative Technologies, Krakow, Poland
STT inefficiency • STT is the base detector for track reconstruction • Low detection efficiency or not response • Mechanical problem or electronics noise 47.106 hits Electronics problem Mechanical damage
error function • complementary error function