Understanding Statistical Accuracy: Factors, Calculations, and Error Reduction Techniques
This document delves into the various aspects of statistical accuracy, including factors that affect it such as count rate, time, background noise, equipment efficiency, and sample volume. It outlines methods for error reduction like peer checks and adherence to procedures. Calculations such as minimum detectable count rate (MDCR) and lower limit of detection (LLD) are presented alongside distributions, confidence levels, and the significance of standard deviation. Essential for ensuring precise and accurate results in statistical analyses.

Understanding Statistical Accuracy: Factors, Calculations, and Error Reduction Techniques
E N D
Presentation Transcript
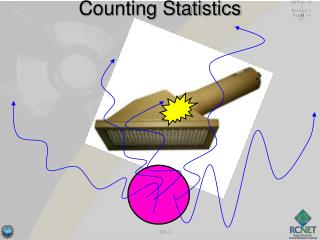
Counting Statistics HPT001.011 Revision 3 Page of 45 31
HPT001.011 Revision 3 Page of 45 32 Statistical Accuracy • Factors that affect statistical accuracy: • Count rate • Count time • Background • Equipment efficiency • Sample vol. • Geometry • Moisture absorption
Events HPT001.011 Revision 3 Page of 45 33 Error Reduction • Peer Check • STAR • Procedure Use and Adherence
Accuracy and Precision 34 HPT001.011 Revision 3 Page of 45
HPT001.011 Revision 3 Page of 45 35 Standard Deviation Where’s the mean? • Represented by the Greek symbol sigma • One is the distance from the peak out to a vertical line enclosing 34.15% of the total area under the curve
HPT001.011 Revision 3 Page of 45 36 Frequency Distribution • Data is plotted on a histogram • Height of bar represents frequency of occurrence
HPT001.011 Revision 3 Page of 45 37 Poisson Distribution • Probability of “success” is low • Number of trials is high
Gaussian Distribution 38 • Symmetrical about the mean • One includes 68.3% of area under curve HPT001.011 Revision 3 Page of 45
Confidence Level 39 1 = 68.3 % confidence level 2 = 95.4 % confidence level HPT001.011 Revision 3 Page of 45
HPT001.011 Revision 3 Page of 45 40 Minimum Detectable Count Rate • Calculated using the equation: MDC = 2.71 + 3.3 [B(tb+ts)/tb]1/2 where: MDC is the minimum dectectable counts; B is the background counts; tb is the background counting time, minutes; ts is the sample counting time, minutes. MDCR = MDC/ts
HPT001.011 Revision 3 Page of 45 41 MDCR Application • If gross count rate is > (Bkd + MDCR): It may be concluded with 95% confidence that radioactivity is present above natural background. Calculate results using normal processes.
HPT001.011 Revision 3 Page of 45 42 MDCR Application (cont’d) • If gross count rate is < (Bkd + MDCR): record as "< MDA".
HPT001.011 Revision 3 Page of 45 43 Lower Limit of Detection • Calculated using the equation: LLD (Ci/cc) = 4.66 b (2.22E6)(E)(V)(Y)(D) where: V is the sample volume in cc; E is the counter efficiency (cts/dis); Y is the chemical yield if applicable; D is the decay correction for delayed count on sample. 2.22E6 is a conversion factor - dpm per Ci
HPT001.011 Revision 3 Page of 45 44 Chi-Square Test • Calculated using the equation: x2 = (n-)2 where: n = the data for each count; = the average of the individual counts; = n/N N = the number of observations (usually 21)
HPT001.011 Revision 3 Page of 45 45 Chi-Square Test