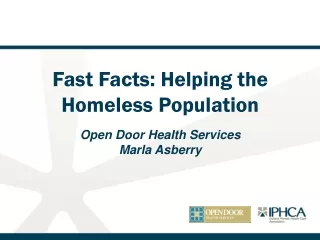
Homeless population
Homeless population. Karly Porter Paula Williams Alisha Eversole Modified by Dr. Carol Albrecht Numbers and charts have been modified, and information has been fabricated – so this slide show should only be used for an example. . Introduction.


Homeless population
E N D
Presentation Transcript
Homeless population Karly Porter Paula Williams Alisha Eversole Modified by Dr. Carol Albrecht Numbers and charts have been modified, and information has been fabricated – so this slide show should only be used for an example.
Introduction • Cache County: 207 homeless children in 2009 • No centralized location to receive services • Outside pressure to serve homeless population
NeedsAssessment • Attitudes of Community Leaders • Available services for individuals who are homeless in Cache Valley
Purpose This study was implemented to evaluate the number and quality of resources available for individuals who are homeless in Cache Valley
Data Collection Telephone and Self-Administered Surveys completed by (95) Community Leaders • Social Service • Civic Leaders • Law Enforcement • Religious • Medical • Educational
Descriptive Statistics for Respondents Gender Number Percent Male 36 37.89 Female 59 62.11 Types of Leaders Social Service 76 40.00 College Student 36 18.95 Civic/Political 12 6.23 Law Enforcement 18 9.47 Religious 18 9.47 Education 22 11.58 Medical 8 4.21
Descriptive Statistics Respondents Average Range Years employed at current job 6.26 0-25 Number of years lived in 15.88 0-59 Cache Valley
Measurement of Perception of Need Programs for Individuals who are Homeless Existence of Programs Respondents indicated (1) YES, (2) Don’t Know or (3) NO Concern about Quality and Quantity of current Programs Respondents indicated (1) not at all concerned to (6) very concerned Quality of Existing Programs Respondents indicated (1) Poor to (5) Excellent
Results Are Adequate Number Homeless Services Available? Number Percent No 56 29.79% Don’t Know 56 29.79% Yes 76 40.43%
Results Are Adequate Number of Homeless Shelters Available? Number Percent No 70 37.23% Don’t Know 76 40.43% Yes 42 22.34%
Results Extent to which you are concerned about the services available for individuals who are homeless (in percent)
Quotes “Need something. Raising awareness of the problems is the first step. Then funding will be the next issue; people need help to afford these services but the tax payers don’t want to help.” -Social Service Worker
Summary and Conclusions Summary • 40% or less felt there were adequate services and shelters. • Majority feel the “homeless problem” is increasing. • Majority feel we lack resources for homeless and are concerned.