Download
1 / 39
390 likes | 594 Vues
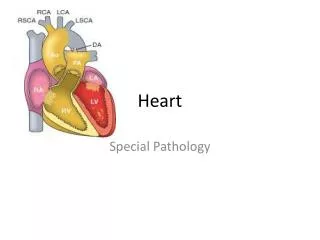
The heart as a pump: outline. Structure of cardiac muscle Excitation contraction coupling Autonomic effects on the heart Cardiac Function Curve Cardiac cycle Ventricular pressure volume loops Control of heart rate and stroke volume. Purkinje Fibers. Branching muscle fiber.

E N D
The heart as a pump: outline Structure of cardiac muscle Excitation contraction coupling Autonomic effects on the heart Cardiac Function Curve Cardiac cycle Ventricular pressure volume loops Control of heart rate and stroke volume
Purkinje Fibers Branching muscle fiber Intercalated disc Arrows show RBCs Characteristics of cardiac muscle Branching fibers with gap junctions at intercalated discs. Electrical syncytium Aerobic metabolism Graded contraction Stretch leads to increased force of contraction Automaticity & Rhythmicity
Ca++ Tn-C tropomyosin Tn-T Tn-I actin Ca++ binding to troponin C allows actin and myosin to form a cross bridge • Tropomyosin blocks myosin binding sites on actin. • Ca++ binds to troponin C and then Troponin I moves tropomyosin, exposing the myosin binding site on actin. • Troponin T holds troponin complex to tropomyosin. During a myocardial infarction, cardiac troponins are released into the circulation. Cardiac and skeletal muscle TnC are identical, but cardiac & skeletal muscle TnI & TnT have different amino acid sequences so they can be differentiated. Detection of cardiac TNi and TnT in the circulation suggests myocardial damage.
Cytosol Pathway for Ca++ entry in myocytes During excitation extracellular Ca++ enters myocytes via transverse tubules Transverse tubule Sarcomere Sarcoplasmic reticulum stores Ca++ Sarcolemma (cell membrane)
Ca++ influx AP contraction 200 msec T-tubule Excitation contraction coupling Extracellular Ca++ Na+ Ca++ Ca++-Induced Ca++ Release Sarcoplasmic recticulum Ryanodine receptor (SR Ca++ release channel) Ca++ SR Ca++ ATPase Ca++ stores Ca++ Ca++ L-type Ca++ channel (dihydropyridine receptor) Contractile mechanism SERCA = sarcoplasmic reticulum Ca++ATPase
Sympathetic stimulation Force At rest Time Sympathetic stimulation of the myocardium increases rate and force of contraction and rate of relaxation • Sympathetic stimulation increases • Force of contraction (positive inotropic effect) • Rate of relaxation (positive lusitropic effect) • Heart rate (positive chronotropic effect) • Conduction velocity (positive dromotropic effect)
b1 adrenergic receptor Norepinephrine inotropic effects actby [Ca++] inside: 1) opening of L type Ca++ channels 2) Ca++ release from sarcoplasmic reticulum Norepinephrine: activity of SERCA which removes Ca++ from tropinin C ( + lusitropic) & stores more Ca++ in SR for next contraction ( + inotropic) NE Gs Ryanodine receptor SR Ca++ ATPase Ca++ Adenylate cyclase Ca++ stores cAMP Ca++ L-type Ca++ channel Protein kinases Ca++ Phosphorylation + + + Contractile mechanism Cellular mechanism of sympathetic effects on myocardium
Aortic valve closes Phases 2,3,4 = Systole EDV - ESV = Stroke Volume Systole = contraction Diastole = relaxation Phases of the cardiac cycle • Phases of cardiac cycle: • Atrial contraction • Isovolumetric ventricular contraction • Rapid ejection • Slow ejection • Isovolumetric ventricular relaxation • Rapid ventricular filling • Slow ventricular filling Figures courtesy of R.E. Klabunde, Ph.D. http://www.cvphysiology.com/
Within the normal range as ventricular muscle is stretched the force of contraction increases. • The Frank-Starling Mechanism: • stretch (preload) • affinity of troponin C for Ca++ force of contraction. • An equivalent statement is: • EDVV stroke volume Cardiac function curve Force of contraction or Stroke Volume Preload: the degree to which the myocardium is stretched just before contraction. Preload for the right ventricle is estimated as central venous pressure (CVP) or right atrial pressure. Preload for the left ventricle is estimated as left atrial pressure by measuring PCWP (Pulmonary capillary wedge pressure) Afterload: the pressure against which blood is ejected from the heart. Afterload for the right ventricle is pulmonary artery pressure during ejection. Afterload for the left ventricle is aortic pressure during ejection. Initial myocardial fiber length or EDVV or atrial pressure The cardiac function curve is an expression of the Frank Starling mechanism CVP is blood pressure at the entrance to the right ventricle
Left atrium & ventricle Pulmonary artery Pulmonary vein Pressure is measured at the tip of the catheter Pulmonary Capillary Wedge Pressure (PCWP) estimates: left atrial pressure = preload for left ventricle left ventricular pressure during diastole To measure PCWP a catheter is passed from the femoral vein into the right heart and advanced as far as possible into a branch of the pulmonary arteries. Blood flow around the catheter is blocked by inflating a balloon. In the absence of flow, pressure is the same everywhere in the column of fluid between the tip of the catheter & the left atrium. Further, when the mitral valve is open during diastole pressure at the catheter estimates left ventricular pressure (also an estimate of preload for the left ventricle). PCWP is measured in the ICU to monitor cardiac function.
Venous return & cardiac output are equal except for momentary adjustments. What comes in goes out. Heart Cardiac function curve Venous return is the blood flow at the entrance to the right atrium Stroke Volume Cardiac output End-diastolic ventricular volume Venous return Systemic vasculature • Equality of venous return and cardiac output is the result of • Frank Starling mechanism (intrinsic to the heart) • Autonomic reflexes (extrinsic to the heart; to be discussed in a subsequent lecture)
The Frank-Starling mechanism maintains equal cardiac output from the left and right heart For example, when a person lies down blood pooled in the veins in the legs and abdomen shifts to the thorax, increasing CVP and right atrial preload. As blood shifts to the thorax,CVP increases & SV from rt ventricle > SV from lft ventricle. Within a few heart beats, SV from the lft ventricle increases to equal SV from the rt ventricle Recumbency Blood shifts to thorax Preload for right side ↑ central venous pressure (CVP) Preload for left side ↑ left atrial pressure ↑ stroke volume from right ventricle ↑ stroke volume from left ventricle ↑ pulmonary arterial blood flow Any maneuver that causes a change in stroke volume in one ventricle will rapidly result in a parallel change in stroke volume in the other ventricle. CVP is blood pressure at the entrance to the right ventricle
Changes in contractility Ejection fraction and contractility Contractility: a change in stroke volume at any given preload & afterload Cardiac function curve Sympathetic stimulation: Positive inotropic effect Stroke Volume Normal Heart failure: Negative inotropic effect Ejection fraction: EF = SV/EDVV (stroke volume/end diastolic ventricular volume) Normal EF = 0.60 or 60% End-diastolic ventricular volume Vagal stimulation has a small negative inotropic effect.
increased dP/dt = contractility normal dP/dt decreased dP/dt = contractility 120 Two indices of contractility: Change in dP/dt; dP/dt = the rate of change of ventricular pressure during ejection at a given end diastolic volume (preload) Change in EF; EF = SV/EDVV 80 LV pressure, mm Hg 40 0.20 0.40 0.60 seconds dP/dt, ejection fraction & contractility
Aortic stenosis resistance Ventricular pressure RELATIONSHIP BETWEEN CARDIAC OUTPUT AND OXYGEN UPTAKE 20 Pressure work 2 R = 0.88 for linear regression 16 CARDIAC OUTPUT, L/min 12 Coronary flow Cardiac QO2 8 4 angina 0 0 0.5 1 1.5 2 2.5 3 OXYGEN UPTAKE (QO2) 2 Three components of cardiac work Volume work related to stroke volume Pressure work related to arterial pressure during systole Kinetic work related to velocity of blood during ejection At rest: Cardiac work ~ stroke volume x arterial pressure Kinetic component negligible (kinetic component increases in strenuous exercise) O2requirement is greater for pressure work than volume work Pressure-volume work & myocardial QO2
ejection Isometric relaxation Isometric contraction Stroke volume Pressure, mm Hg filling ESV Volume, ml EDV A pressure-volume loop shows changes in ventricular volume and pressure during one cardiac cycle Ventricular pressure - volume loop Filling represents passive characteristics of the ventricle. Isometric contraction and ejection represent active force of myocardial contraction
Compliance is the change in unit volume of a structure per unit change in pressure. More compliant structures get bigger for a given increase in pressure, compared to less compliant ones. Veins are 19 times more compliant than arteries. The filling of the ventricles is determined partly by their compliance. In people with chronic heart failure, ventricular compliance decreases, limiting filling and stroke volume. Compliance
Effect of an increase in preload on PV loop (change in diastolic function) If afterload & contractility are constant, an increase in preload increases end diastolic ventricular volume & stroke volume (Frank-Starling mechanism) Preload is increased by Atrial contraction Blood volume Venous tone Skeletal muscle pump Respiratory pump End systolic volume Pressure, mm Hg End diastolic ventricular volume filling Filling of the ventricle is determined by two factors: Preload Ventricular compliance Volume, ml Stroke volume = end diastolic volume minus end systolic volume
At constant preload & contractility, an increase in afterload decreases stroke volume (change in systolic function) afterload End diastolic ventricular volume Pressure, mm Hg End systolic volume Ventricular filling Volume, ml An increase in afterload requires more energy to eject blood against the increased arterial pressure so less energy is available for fiber shortening. As a result stroke volume is decreased (end systolic volume is increased).
An increase in afterload decreases stroke volume so end systolic volume is greater Ventricular filling Pressure, mm Hg End diastolic ventricular volume Pressure, mm Hg End systolic volume End Systolic Volume, ml SV Volume, ml AP ESV SV An increase in end systolic volume means stroke volume is decreased.
Normally when afterload increases SV is maintained by an increase in contractility 120 100 MAP* 80 HR* 3 min isometric handgrip exercise 60 Asterisk indicates statistically significant change SV 40 TPR/100 20 Cardiac index increased from 3.5 to 4.4 L/min x m2 CI* Rest Exercise During exercise MAP (afterload) increases with no change in stroke volume. Cardiac contractility must have increased to maintain stroke volume with increased afterload. Cardiac work is increased also.
The failing heart may not be able to increase contractility when afterload increases Therapy for heart failure includes agents that lower afterload SVR = systemic vascular resistance (TPR) UpToDate;Pathophysiology of heart failure: Left ventricular pressure-volume relationships.W. S Colucci.
stimulated End diastolic ventricular volume normal Pressure, mm Hg Ventricular filling End systolic volume Volume, ml Beta 1 adrenergic stimulation increases stroke volume Norepinephrine: contractility end systolic volume stroke volume end systolic pressure Norepinephrine (in blood & from sympathetic nerves) acts on ventricularb1 adrenergic receptors to increase contractility (positive inotropic effect)
Systolic dysfunction: a decrease in contractility decrease in stroke volume Filled shape shows smaller pressure volume loop with systolic dysfunction contractility normal ejection End systolic ventricular volume Pressure, mm Hg stroke volume Volume, ml With systolic dysfunction both stroke volume and peak arterial pressure are decreased
Partial compensation occurs for the initial decrease in stroke volume. The initial decrease in stroke volume results in blood “backing up” on the venous side of the circulation which results in increased venous pressure, preload & stroke volume. Compensation occurs commonly in heart failure, for example. Compensation for systolic dysfunction stroke volume (left ventricle) Initial decrease in stroke volume normal left atrial, pulmonary & right atrial pressure Partial compensation: end diastolic volume & stroke volume are increased. preload Pressure, mm Hg end diastolic ventricular volume stroke volume Volume, ml
Compliance is defined as how much the volume of a vessel changes per unit change in pressure: Changes in the compliance of the heart or blood vessels affect their function. A decrease in compliance of the ventricles occurs in heart failure due to changes in both active and passive relaxation Active relaxation refers to the activity of the SERCA transporter that sequesters Ca++ in the sarcoplasmic reticulum during relaxation. This ATP dependent process is inhibited in ischemia, impairing relaxation of the contractile proteins. Passive relaxation refers to the compliance of the myocardial tissue. Fibrosis or other cardiomyopathies may produce a chronic decrease in compliance Diastolic function, compliance & relaxation SERCA = sarcoplasmic reticulum Ca++ATPase Compliance is different from conductance, also abbreviated C. Conductance is the inverse of resistance:
ventricular compliance ventricular pressure normal compliance Pressure, mm Hg filling End diastolic ventricular volume end diastolic ventricular volume Ventricular pressure stroke volume Volume, ml cardiac output Diastolic dysfunction Diastolic dysfunction is due to decreased compliance of the ventricle resulting from impaired active and/or passive relaxation Filling of the ventricle is determined by preload and ventricular compliance
Preload Contractility afterload Contractility afterload Preload End diastolic ventricular volume End systolic volume End diastolic ventricular volume End systolic volume Stroke volume Stroke volume Stroke volume = end diastolic volume minus end systolic volume Stroke volume is a function of preload, contractility and afterload Preload drives filling Contractility affects force of contraction Afterload resists ejection
Mean arterial pressure is determined by cardiac output and total peripheral resistance Since CVP ~ zero, using MAP for the average driving pressure in the circulation, and TPR for total peripheral (systemic) resistance:
Cardiac output, heart rate and stroke volume CO = HR x SV CO (cardiac output, ml/min) = heart rate (beats/min) times stroke volume (ml/beat) HR is regulated primarily by the autonomic nervous system SV is regulated by the Frank Starling mechanism (intrinsic) and by the autonomic nervous system (extrinsic)
Sympathetic activity Slope of pacemaker potential Threshold for AP more negative Heart rate Sympathetic stimulation increases heart rate Resting heart rate 0 -20 -40 -60 -80 Slope Slope Sympathetic stimulation 0 -20 Increasing the slope of the pacemaker potential means the action potential for the next beat occurs sooner. A more negative threshold means less depolarization is needed to elicit an action potential -40 -60 -80
parasympathetic activity 0 Hyperpolarize resting membrane (more negative) Slope of pacemaker potential -20 -40 -60 -80 Heart rate Parasympathetic effects on heart rate Resting HR Slope Slope Normally parasympathetic tone keeps the resting HR lower than the intrinsic HR The intrinsic HR is the rate in the absence of nerves or hormones Resting HR = 60 to 70 B/min Intrinsic HR = 100 B/min Parasympathetic stimulation 0 -20 -40 -60 -80 - - - - Threshold for AP = – 55 mV at rest
Sympathetic activity Parasympathetic activity Circulating epinephrine Heart rate Summary of factors regulating heart rate The HR is set by the balance between sympathetic and parasympathetic tone acting on the SA node. HR is due to parasympathetic and sympathetic stimulation HR is due to parasympathetic and sympathetic stimulation Blood borne epinephrine has a minor effect on HR similar to sympathetic tone
Intrinsic Extrinsic epinephrine Sympathetic activity Preload afterload Contractility Force of contraction Stroke volume Stroke volume is a determined by preload, contractility and afterload. Contractility and rate of relaxation of the ventricles are both increased by b1 adrenergic stimulation. Indices of contractility: Change in dP/dt Change in EF: Summary of factors regulating stroke volume
Sympathetic activity & Parasympathetic activity Sympathetic stimulation Heart rate Rest Force Time Effect of sympathetic stimulation on force & duration of contraction As HR increases from 75 to 200 B/min, duration of systole decreases 41%, duration of diastole decreases 74% At HR > 180 B/min, ventricular filling is compromised. Tachycardia > 180 B/min may limit cardiac output.
Autonomic effects on ventricular myocardium Sympathetic stimulation: Force of contraction (positive inotropic effect) Rate of relaxation (positive lusitropic effect) Conduction velocity (positive dromotropic effect) Parasympathetic stimulation: conduction velocity in the AV node (negative dromotropic effect) Ventricular contractility (negative inotropic effect, weak effect compared to sympathetic stimulation of contractility). Terms relating to cardiac function: Chronotropic: affecting heart rate Dromotropic: affecting conduction velocity Inotropic: affecting contractility Lusitropic: affecting rate of relaxation
Natriuretic peptides The heart synthesizes and secretes peptide hormones in response to increased stretch of the cardiac chambers. These hormones act to increase urinary Na+ excretion. • Cardiac natriuretic hormones: • Atrial Natriuretic peptide (ANP): 28 amino acid peptide secreted from the atria in healthy people in response to increased NaCl intake or blood volume. • B – type Natriuretic Peptide (BNP): secreted from ventricles in heart failure. Increasing plasma BNP concentration correlates with worsening cardiac function. BNP can be measured rapidly at the bedside: • to assist in differential diagnosis of dyspnea & • as an indication of the degree of heart failure. • C-type Natriuretic Peptide: secreted by vascular endothelial cells. ANP was originally called ANF (atrial natriuretic factor) BNP is also called brain natriuretic peptide because it was first found in the CNS.
After cardiac transplantation the heart adapts to exercise by increasing SV Normal Cardiac Transplant exercise exercise QO2 Cardiac output Heart Rate Stroke Volume Normally the increase in CO with exercise is mostly due to increased HR. After transplantation (which denervates the heart) increased SV due to the Frank Starling mechanism maintains CO with exercise.
Effect of age on cardiac function Problem of separating effects of aging from disease & cumulative injury Aortic compliance resistance to ejection systolic pressure Number of myocytes compensatory hypertrophy Ventricular active & passive relaxation Maximal heart rate These changes contribute to decreased maximal oxygen consumption and exercise capacity with age. The effects of aging can be ameliorated by exercise.