Download
1 / 43
430 likes | 545 Vues
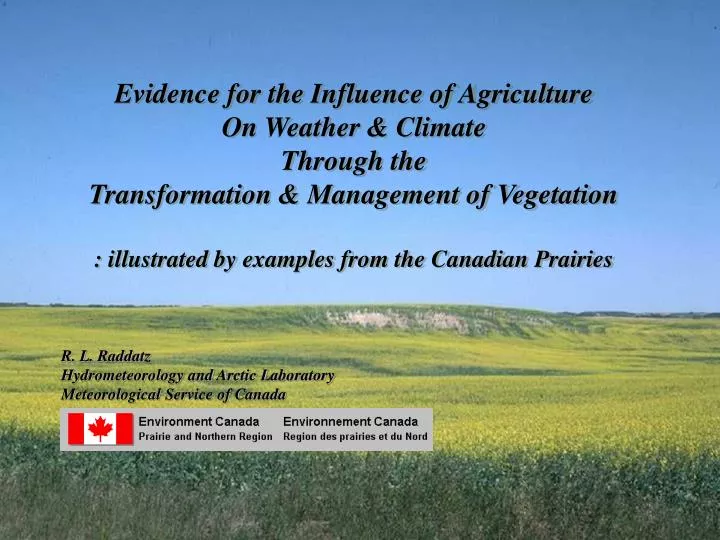
Evidence for the Influence of Agriculture On Weather & Climate Through the Transformation & Management of Vegetation : illustrated by examples from the Canadian Prairies. R. L. Raddatz Hydrometeorology and Arctic Laboratory Meteorological Service of Canada.

E N D
Evidence for the Influence of Agriculture On Weather & Climate Through the Transformation & Management of Vegetation : illustrated by examples from the Canadian Prairies R. L. Raddatz Hydrometeorology and Arctic Laboratory Meteorological Service of Canada
Land Surface – Atmosphere Interaction Moisture (mass) balance of surface layer of the land: P = I +E+T+ R + D +∆Sw Surface energy balance: Q* = QG + QH + QE Moisture (mass) balance of the atmosphere: P =E+T+ ( F+ - F- ) + ∆Sv
Main Properties of Vegetation (that influence the transfer of heat, moisture and momentum from land surface to overlying air) Physiological - leaf area - stomatal resistance - rooting depth Physical - albedo - roughness length + Impact of vegetation on soil moisture Including Irrigation (Arora, 2002)
Vegetation Transformation & Management by Agriculture 15-18 million km2 Cropland (12%) 34 million km2 Pasture & Range Land (22%) (Leff et al., 2004)
Illustrative examples from: Cropped Grassland Eco-climatic Region Canadian Prairies Provinces 50% of area in annual field crops Annual field crops are a primary source of Evapotranspiration
1st Generation Prairie Crop Phenology & Water Use Model Vegetation Weather Soil - spring wheat - daily precipitation - available water - Perennial grasses - maximum temperature holding capacity - minimum temperature - incidental solar radiation - photoperiod Planting Date Initial Soil Moisture Heat Units Precipitation Potential Evapotranspiration Vegetative Cover Water Balance Model Water-Demand Consumptive Use Rooting Depth Available Soil Moisture Water-Use
Planting Dates Initial Soil Moisture Soil Moisture Module PBL Module Growth Module Vapour Deficit & Aerodynamic Resistance Top-Zone Root-Zone Crop Stage Crop Water-Demand Leaf-Area Soil Resistance & Skin Humidity Canopy Resistance Rooting Depth Crop Water Use 2nd Generation Prairie Crop Phenology & Water Use Model • Crop • Wheat • Canola • Potatoes • Weather • Daily Precipitation • Daily Temperature Extremes • Gridded upper-air data • Photoperiod • Soil • Soil Textural Class • Terrain Heights • Drag coefficients Column Model
Land Surface – Atmosphere Coupling Often via the Vegetation(Basara & Crawford, 2002) • strong linear relationship between root-zonesoil moisture • and - Evaporative fraction ETf = QL / ( QH + QL ) • - Near surface • - maximum temperatures • - afternoon mixing ratios • - Boundary layer • - mean potential temperatures • - mean mixing ratios • correlation with top zone soil moisture was weak and non-linear
Impact of Annual Crops (and green-up of Deciduous Trees) on the Evaporative Fraction July 10 Cropped Transitional Grassland Canadian Prairies Lower mean afternoon mixing-layer depths in June & July than in May due to increase QL and reduced QH due to transpiration from annual field crops and from aspen groves July 10
1135 CST Initiation 1005 CST No cloud Initiation of Convection With Weak Synoptic Forcing 1335 CST Max area
Time of convective initiation more highly correlated with root-zone than with top-zone soil moisture R = 0.77 Atmospheric Boundary Layer – Soil Moisture Coupling • Occurs, primarily, via the vegetation.
Cumulus Convection – Soil Moisture Feedback • Where annual crops dominate the vegetation, the primary cumulus convection – soil moisture feedback occurs on the seasonal time scale.
Agriculture & Weather and Climate Through agriculture (land clearing, cultivation, and the grazing of domesticated animals), man has transformed, and now manages to varying degrees, the vegetation (i.e., the physiological and physical properties of the land cover), and directly (via irrigation) or indirectly (via the vegetation) the soil moisture over large tracks of land. By altering the properties of the vegetation, agriculture influences the magnitude of the net radiation (via surface albedo), and how this energy is partitioned into sensible and latent heat fluxes (via stomatal resistance). It may also influence the vertical flux of momentum (via the roughness length). Agriculture also has an impact upon the aerodynamic coupling between the land surface and the atmosphere (via aerodynamic resistance), and, thus, it has a further impact on the surface fluxes.
Evidence for the Influence of Agriculture on Weather & Climate Tables:(Extensive but not comprehensive) Region | Ag-Impact | Wx Element | Obs or Mdl | Author Framework for GroupingStudies 1. Agriculture’s Influence on Near Surface Weather Elements. 2. Agriculture’s Influence on the Regional Hydrologic Cycle** 3. Agriculture - Tele-connections & Inter-seasonal Influence.
Agriculture’s Influence on Tmax & Afternoon Mixing Ratios (1988-1995)
Incremental Change Mean Daily Maximum Temperatures & Afternoon Mixing Ratios More Humid Drier Drier
Plains-to-Mountains Circulation (Influence adjacent areas - Local effects become regional effects) Stohlgren et al., 1998 Chase et al, 1999 Strong, 2000 Influence on Foothills Weather Impact upon Plain’s Vegetation
Agriculture’s Influence upon the Regional Hydrologic Cycle • (1) Affects the availability of convective energy (CAPE). • (2) Affects the availability of water vapour (Recycling Ratio). • Spatial discontinuities in vegetation and/or soil moisture • can induce mesoscale thermal circulations (land-land breezes) • that initiate moist deep convection.
Moist deepconvection - Results from the release of CAPE when boundary-layer air parcels lifted to level of free convection by a dynamic or thermal mechanism. Severe Weather from Thunderstorms - Flooding - Hail - Tornadoes - etc. Convective Rainfall Pielke et al, 2001
Cropped Grassland Eco-climatic Region – Canadian PrairiesET = f (Weather, Vegetation Phenology & Soil Moisture) Sensible Heat Latent Heat Bowen Ratio = Sensible Heat Latent Heat where Bo > 1.0 (Sensible > Latent ) Bo < 1.0 (Latent > Sensible) Net Radiation Q* = QG + QH + QE Evapotranspiration from the annual field crops controls the seasonal pattern of the partitioning of the surface net radiation.
Lifted Index : LI = T50 - Tparcel A widely used measure of the amount of CAPE for the development of moist deep convection LI > 0 LI = 0 to -3 LI < -3
Reduction in Lifted Index due to Regional Evapotranspiration Reduction LI = Increase CAPE (Segal et al, 1995)
Transitional Grassland Wheat Grasses
Example:CAPE highly sensitive to low-level moisture 1400 to 3200 J kg-1 Convective Available Potential Energy (CAPE) 11 to 15 g kg-1 Winnipeg $60 million Hail Storm Specific Humidity of CBL 4 mm d-1 Evapotranspitation attributed to Agro-ecosystem July 16, 1996
Demonstrates link between regional evapotranspiration from crops and moist deep convection
Regional Atmospheric Water Balance F+ F- Re Ri ET F+ = horizontal influx of water vapour F- = horizontal efflux of water vapour Re = areal average rainfall from external moisture ET = areal average or regional evapotranspiration Ri = areal average rainfall from internal moisture (Budyko, 1982, Brubaker, 1993, Trenberth, 1999)
Summer Recycling Ratio for Region • Ri / R = 1 / ( 1+ ( 2F+ / (ET*A )) • where ( R = Re + Ri ) • Relative contribution of water vapour from regional evapotranspiration to total rain • Measure of importance of evapotranspiration to the regional hydrologic cycle.
Advection or Horizontal Flux ( F + and F- ) * * * * * * “q” is liquid equivalent of the water vapour in the atmospheric column ( 100 to 25 kpa ) . “u” & “v” are vertical mean, with mixing ratio weighting, wind components.
Wheat Modeling Sites Rainfall & Land-use weighted Evapotranspiration
Summer Recycling Ratio for Region SummerRecycling Ratio 1997 24% 1998 35% 1999 25% Regional ET (i.e., recycled regional moisture) is a significant source of water vapour mass for summer rainfall. (Bosilovich & Schubert, 2002 Summer recycling ratio for western Canada (1990-1995) is 29%.
June – July - August • Cropped Grassland • Eco-climatic Region • Canadian Prairies • poor correlation between • horizontal influx (advection) • of moisture and summer rain. • good correlation between • regional moistening efficiency • and summer rainfall, where • M = ET*L / F, and • ET = f (crop stage, • soil moisture) June – July - August M = ET*L / F Trenberth, 1999
Agriculture’s Influence on Mesoscale Thermal Circulations Spatial discontinuities in vegetation and/or soil moisture can induce mesoscale thermal circulations (land-land breezes) that may initiate moist deep convection. (Segal & Arritt, 1992; Lee & Kimura, 2001).
Mixing-Layer Depth Sensible Heat Flux Land – Land Breeze Meso-scale circulation induced by ET discontinuity
Mixing-Layer Depth Sensible Heat Flux Land – Land Breeze Wet | Dry Meso-scale circulation induced by ET discontinuity
1135 CST Initiation 1005 CST No cloud 1335 CST Max area
Tele-connections Thunderstorms are conduits for heat & moisture from lower to higher altitudes. Thus, spatially coherent and persistent patterns of moist deep convection, in the tropics and during mid-latitude summers, may influence the ridge and trough positions in the polar jet stream. Agriculture, by having an impact upon deep convection, particularly in Tropics, can affect the weather on a global scale. (Chase et al., 1996; Chase et al., 2000; Zhao et al., 2001)
Inter-Seasonal Influence A high level of root-zone soil moisture in the spring, and vegetation to transfer that moisture to the atmospheric boundary layer during the growing season, are necessary, though not sufficient, conditions for a convectively active summer. May 31, 2002 ( Shukla & Mintz, 1982; Timbal et al., 2002; Koster and Suarz, 2004; GLACE Team, 2004) May 30, 2004
Soil Moisture Hot Spots (Global Land Atmosphere Coupling Experiment) - Regions where soil moisture anomalies have a substantial impact on summer rainfall. - Transition zones between wet & dry areas where adding moisture to the boundary layer can lead to moist deep convection and where ET is relatively high but still sensitive to soil moisture. -Through agriculture (land clearing, cultivation, and the grazing of domesticated animals), man has transformed, and now manages to varying degrees, the vegetation and directly (via irrigation) or indirectly (via the vegetation) the soil moisture over large tracks of land.
Cropped Grassland • Eco-climatic Region • Canadian Prairies • good correlation between regional moistening efficiency and summer rainfall, where ET = f (crop stage, soil moisture) • poor correlation between spring soil moisture and summer rainfall. Thus, agriculture influences the current season’s convective rainfall, but the inter-seasonal influence is weak. M = ET*L / F
Evidence for the Influence of Agriculture on Weather & Climate Tables:(Extensive but not comprehensive) Region | Ag-Impact | Wx Element | Obs or Mdl | Author Framework for GroupingStudies 1. Agriculture’s Influence on Near Surface Weather Elements. 2. Agriculture’s Influence on the Regional Hydrologic Cycle** 2.1 Convective Available Potential Energy (CAPE) 2.2 Regional Moisture Recycling 2.3 Mesoscale Thermal Circulations 3. Agriculture - Tele-connections & Inter-seasonal Influence.