Download
1 / 31
320 likes | 511 Vues
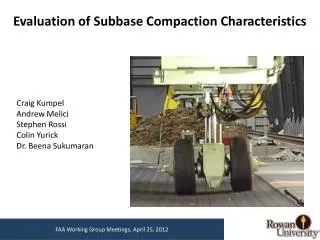
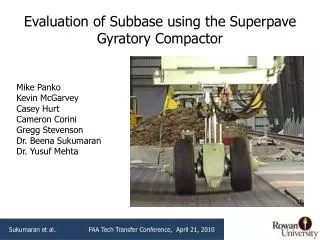
Evaluation of Subbase using the Superpave Gyratory Compactor. Mike Panko Kevin McGarvey Casey Hurt Cameron Corini Gregg Stevenson Dr. Beena Sukumaran Dr. Yusuf Mehta. Background. Continuous loading from airplane wheels create ruts in pavement

E N D
Evaluation of Subbase using the Superpave Gyratory Compactor Mike Panko Kevin McGarvey Casey Hurt Cameron Corini Gregg Stevenson Dr. Beena Sukumaran Dr. Yusuf Mehta Sukumaran et al. FAA Tech Transfer Conference, April 21, 2010
Background • Continuous loading from airplane wheels create ruts in pavement • Bigger and heavier planes with complex gear configurations make rut prevention more difficult • FAA believes rutting is caused by densification of subbase Sukumaran et al. FAA Tech Transfer Conference, April 21, 2010
NAPTF – Rutting Behavior North wheel track of CC3 flexible pavements at 19,500 passes Picture courtesy of NAPTF Sukumaran et al. FAA Tech Transfer Conference, April 21, 2010
Field Compaction Interface profile measurements in the LFC2 posttraffic trench Courtesy of Garg and Hayhoe Sukumaran et al. FAA Tech Transfer Conference, April 21, 2010
Outline • Background and Objectives • Results from testing on P-154 • DGA Field to lab Comparison • Conclusions • Future Work Sukumaran et al. FAA Tech Transfer Conference, April 21, 2010
Research Approach SGC Compare Compaction Curves Nuclear Density Gauge Field Compaction Sukumaran et al. FAA Tech Transfer Conference, April 21, 2010
Variables Angle Pressure # of Gyrations Gyratory Compactor Sukumaran et al. FAA Tech Transfer Conference, April 21, 2010
Shearing Action Sukumaran et al. FAA Tech Transfer Conference, April 21, 2010
Gyratory Compactor and Soil Parameters • Angle Used: 1.25° • Pressure Used: 600, 800, 1000 kPa • # of Gyrations: 400 Gyrations • Water Content Ranges:1-2%, 2-3%, 3-4%, 4-5%, 5-6% • Sample Size: 3000 grams Sukumaran et al. FAA Tech Transfer Conference, April 21, 2010
P-154 Sukumaran et al. FAA Tech Transfer Conference, April 21, 2010
P-154 Results • Determined OMC using Modified Proctor • Compared SuperPave Gyratory Compactor Results to Modified Proctor • Determined Compaction Energy using a Pressure Distribution Analyzer Sukumaran et al. FAA Tech Transfer Conference, April 21, 2010
Compaction Properties of P-154 Sukumaran et al. FAA Tech Transfer Conference, April 21, 2010
Comparison of SGC and Construction Compaction Sukumaran et al. FAA Tech Transfer Conference, April 21, 2010
MDD Placement in P-154 Sukumaran et al. FAA Tech Transfer Conference, April 21, 2010
P-154 Comparison of Field and SGC Compaction Sukumaran et al. FAA Tech Transfer Conference, April 21, 2010
CompactionEnergy Sukumaran et al. FAA Tech Transfer Conference, April 21, 2010
Shear Work Sukumaran et al. FAA Tech Transfer Conference, April 21, 2010
VerticalWork wv = vertical work (in-lb) P = Pressure (600 kPa ~ 87 psi) A = Cross Sectional Area (28.27 in2) ∆h = change in height of sample (in) Sukumaran et al. FAA Tech Transfer Conference, April 21, 2010
Compaction Energy per Gyration Sukumaran et al. FAA Tech Transfer Conference, April 21, 2010
DGA Sukumaran et al. FAA Tech Transfer Conference, April 21, 2010
Compaction Properties of DGA Sukumaran et al. FAA Tech Transfer Conference, April 21, 2010
MDD Placement in DGA Sukumaran et al. FAA Tech Transfer Conference, April 21, 2010
DGA Comparison of Field and SGC Compaction Sukumaran et al. FAA Tech Transfer Conference, April 21, 2010
Comparison of Energy per Gyration Sukumaran et al. FAA Tech Transfer Conference, April 21, 2010
SGC vs. Proctor Tests Energy input from Proctor tests come from impact hammer. The SGC can achieve higher densities than the impact hammer alone. The energy input from the SGC comes from the vertical load applied, and the shearing caused by the gyratory movement, resulting in a higher energy. Sukumaran et al. FAA Tech Transfer Conference, April 21, 2010
Conclusions The SGC looks promising in evaluating compaction characteristics of unbound material during construction. The results from the SGC appear comparable to the deflection in the field for P-154 and DGA but needs further evaluation. Sukumaran et al. FAA Tech Transfer Conference, April 21, 2010
Future Work • Continue SGC testing at different moisture contents. • Obtain better field data for P-154, DGA and P-209 for comparison with SGC tests. • Compare SGC compaction energy to field compaction energy. Sukumaran et al. FAA Tech Transfer Conference, April 21, 2010
Acknowledgements Sukumaran et al. FAA Tech Transfer Conference, April 21, 2010 FAA Grant #05-G-016 Dr. Gordon Hayhoe, FAA Several FAA personnel for materials and assistance with the database SRA International personnel for data access and assistance with the database