
High-Frequency Velocity and Temperature Perturbations Induced by Prescribed Fire Simulations
This study explores the high-frequency velocity and temperature perturbations generated by a prescribed fire using the Advanced Regional Prediction System (ARPS). Simulations performed on a 1024-CPU high-performance computer utilized very high spatial (10 m) and temporal (10 Hz) resolution to investigate the impacts of different fire-induced temperature patches (500 K and 1000 K) on local atmospheric conditions. Results indicate that the perturbation characteristics, including turbulent eddies and vertical velocities, are significantly influenced by the temperature of the fire, leading to profound implications for smoke behavior and dispersion.

High-Frequency Velocity and Temperature Perturbations Induced by Prescribed Fire Simulations
E N D
Presentation Transcript
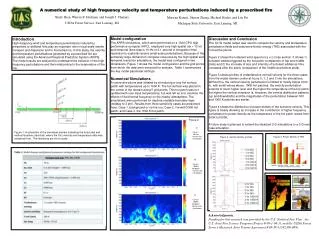
A numerical study of high frequency velocity and temperature perturbations induced by a prescribed fire Xindi Bian, Warren E. Heilman, and Joseph J. Charney USDA Forest Service, East Lansing, MI Marwan Katurji, Sharon Zhong, Michael Kiefer, and Lisi Pei Michigan State University, East Lansing, MI Model configuration The ARPS simulations, which were performed on a 1024-CPU high performance computer (HPC), employed very-high spatial (dx = 10 m) and temporal (time step is 10-Hz or 0.1 second in integration time) resolution to explicitly resolve small-scale perturbations. Because of the extremely large demand on computer resources by the high spatial and temporal resolution simulations, the model was configured in two dimensions. Figure 1 shows the model configuration and the grid points from which the data were extracted for analysis. Table 1 summarizes the key model parameter settings. Numerical Simulations A convective plume was initiated by introducing a very hot surface patch with temperatures up to 1000 K. The hot surface was placed in the center of the domain along 5 grid points. This hot patch was not updated with user input temperatures, but was left as is to examine the effects of the thermal buoyancy on the nearby atmosphere. The simulations were performed for daytime unstable boundary layer (midday to 3 pm). Results from three sensitivity cases are presented here: Case-1, background or no-fire run; Case-2, fire with 500K hot patch; and Case-3, the 1000 K hot patch. Discussion and Conclusion The 10 Hz model output was used to compute the velocity and temperature perturbation fields and turbulence kinetic energy (TKE) associated with the convective plume. Figure 2 shows the turbulent wind speed on a x-z cross-section. It shows 1) turbulent eddies triggered by the hot patch (comparison of top and middle plots) and 2) the increase of size and intensity of turbulent eddies as time increases after fire starts (comparison of the middle and bottom plots). Figure 3 shows profiles of instantaneous vertical velocity for the three cases from the model domain center at hours 0, 1, 2 and 3 into the simulations. Without fire, the vertical velocity perturbation is limited to mostly below 1000 m, with small values above. With hot patches, the velocity perturbation extends to much higher level and the higher the temperature of the hot patch, the higher the vertical extension is. However, the vertical distribution patterns (up and downdrafts) and the magnitudes of the perturbation between 500 and 1000 K patches are similar. Figure 4 shows the distribution of power density of the turbulent velocity. This figure is clearly showing an increase in the contribution of higher frequency perturbation to power density as the temperature of the hot patch raised from 500K to1000K. A future study is planned to extend the idealized 2-D simulations to a 3-D real case simulation. Introduction High-frequency wind and temperature perturbations induced by prescribed or widlland fires play an important role in local-scale smoke transport and dispersion and in fire behaviors. In this study, the velocity and temperature perturbations generated by a prescribed fire are simulated using the Advanced Regional Prediction System (ARPS). The model results are analyzed to understand the behavior of the high frequency perturbations and their relationship to the temperature of the fire. • Figure 2. • (a) • Case-1 • No-fire • (10 min into simulation) • (b) • Case-3 • 1000 K • hot patch • (10 min into simulation) • (c) • Case-3 • 1000K • hot patch • (60 min into simulation) Figure 1. A schematic of the simulated domain indicating the horizontal and vertical locations (red dots) where the 1Hz velocity and temperature data was extracted from. The distances are not to scale. Figure 4. Power density of TKE Figure 3. vertical velocity profiles Acknowledgments. Funding for this research was provided by the U.S. National Fire Plan , the U.S. Joint Fire Science Program (Project # 09-1-04-1), and the USDA Forest Service (Research Joint Venture Agreement # 09-JV-11242306-089).


