Download
1 / 17
170 likes | 296 Vues
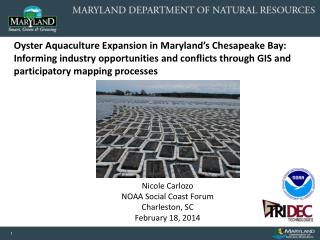
Integrating Water Quality and Coastal Resources into Marine Spatial Planning in the Chesapeake and Atlantic Coastal Bays: Oyster Aquaculture. Nicole Carlozo NOAA Coastal Management Fellow October 29, 2013. Goals:

E N D
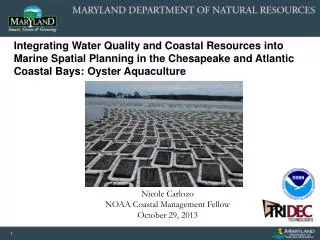
Integrating Water Quality and Coastal Resources into Marine Spatial Planning in the Chesapeake and Atlantic Coastal Bays: Oyster Aquaculture Nicole Carlozo NOAA Coastal Management Fellow October 29, 2013
Goals: Identify high priority aquaculture and coastal restoration areas that align with TMDL water qualitygoals. Prioritize identified areas where investment in or support of aquaculture and natural filter projects would result in water quality improvements related to the TMDL. Develop recommendations about the best ways to balance competing water uses and coastal restoration practices. 2
Project Phases: • General Targeting Model (bottom, caged, floating) • Environment (water quality) • Policy constraints • Prioritization Methodology • Oyster health • Nutrient reduction potential (STAC Report) • Estimate nutrient reduction potential (pilot areas) • Develop Recommendations for balancing restoration with competing coastal/marine uses • pGIS Workshop (December 2013)
Policy Model - Constraints ADDITIONAL: • Exclude Potomac River main stem (leasing not available) • Exclude marina buffers (area depends on slip number) – MDE Data • Consider navigation fairways • Consider bathymetry CURRENT: • SAV zone (5 years) • Oyster Planting Areas (6 years) • Closed Harvest Areas • Public Shellfish Fishery Area (150 ft buffer) • Harvest Reserve Area (150 ft buffer) • Pound net sites (150 ft buffer) • Yates bars within sanctuaries (150 ft buffer) • Protected Lands • Federal navigation channels (150 ft buffer) • Shoreline (50 ft buffer) • MD artificial reef initiative sites • Current shellfish leases
Other Policy Considerations • Oyster Sanctuary Status (≤ 10% sanctuary acreage) • Waterfowl Concentration Area (WHS Review) • Sensitive Species Area (WHS Review) • Wetlands of Special State Concern (WHS Review) • Cultural/Historic Resources (MHT Review) • Navigation buoys (250 ft buffer) (Army Corps of Engineers / Coast Guard Reviews) • Blind spots (500 yard buffer)
Dissolved Oxygen Analysis Number of Active Chesapeake Leases Intersecting Hypoxic Waters
UPDATES • Water Quality: • Remove Dissolve Oxygen constraints from the floating culture model • Use 29°C as the temperature constraint (point where oysters are threatened by high internal vibrio concentrations) • Substrate: • Include sand and sand/mud complex bottom for Caged Aquaculture • Include sand/mud complex bottom for Bottom Aquaculture
Oyster Aquaculture Targeting Results • GIS Online Map • Visualize how factors influence aquaculture expansion
Goals: Identify high priority aquaculture and coastal restoration areas that align with TMDL water quality goals. Prioritize identified areas where investment in or support of aquaculture and natural filter projects would result in water quality improvements related to the TMDL. Develop recommendations about the best ways to balance competing water uses and coastal restoration practices. 10
Priority Areas • Long-term survival • Reduced disease risk • Ability to harvest • Suitable substrate for reduced maintenance
Next Steps: Nutrient Reduction Estimates Oysters can reduce nutrient levels via 3 pathways: • Assimilate nutrients (N, P) into shell and tissue biomass (removed via harvest) • Burial of biodeposits (undigested materials + feces) including N and P • Buried biodeposits undergo nitrification-denitrification coupling, which releases N2 gas into the atmosphere. 3 1 2 Nutrient cycling under oxygenated conditions with limited light (Newell and Mann 2012).
Next Steps: Nutrient Reduction Estimates STAC Report, September 2013 Findings: Average N content: 8.2% of tissue dry weight (DW) and 0.21% of shell DW. Average P content: 1.07% of tissue DW and 0.06% of shell DW. Estimate nutrient removal from harvest data Burial rates of nutrients associated with biodeposits are not currently known. Enhanced denitrification (DNF) rates at aquaculture sites has not been observed. DNF rates at oyster reefs typically exceed background levels, but are highly variable due to locations, season, and other site-specific characteristics (oyster biomass, tidal exposure, depth relative to the euphotic zone, and unknown factors). 13
Next Steps: Nutrient Reduction Estimates What do these findings mean for this project? • Only tissue/shell assimilation can be quantified at this time. • Post-harvest • Shells cannot be returned to the water • How site conditions impact nutrient reduction/filtration is unknown. • Prioritization by site conditions is not feasible • Prioritization within each aquaculture method (spat-on-shell, caged, floating) is not feasible • Questions: • Do we want to add to the current prioritization models in light of this road block? • How can these siting models be used, if not for identifying BMP hotspots?
Goals: Identify high priority aquaculture and coastal restoration areas that align with TMDL water quality goals. Prioritize identified areas where investment in or support of aquaculture and natural filter projects would result in water quality improvements related to the TMDL. Develop recommendations about the best ways to balance competing water uses and coastal restoration practices. 15
Next Steps: Identify Marine Use Conflicts Where may aquaculture impact coastal and marine users? Participatory GIS (pGIS) Workshop Photos by Chris Cortina
Discussion • If we can’t move forward with identifying BMP hotspots at this time, do we want to add to or continue with the current aquaculture prioritization models? • How might these suitability models fit into broader aquaculture or planning efforts? • Do any data needs exist in terms of planning for aquaculture expansion? Could any additions to these data address those needs? • Will the upcoming pGIS workshop address those needs? • The pGIS workshop can also be used to gather qualitative information/feedback from stakeholders. • Could this information be used to incentivize aquaculture or to aid marketing efforts?