Download
1 / 41
420 likes | 606 Vues
LIVING ON A RADIOACTIVE PLANET THE PROS AND CONS. Sarah Lawley. OUTLINE OF TALK. Background Radiation Dose-response Epidemiology Radiobiology Conclusions. Y YOU ARE HERE. Gamma spectrum from Uranium ore . Bismuth 214 Energy 609 keV. Radiation Units.

E N D
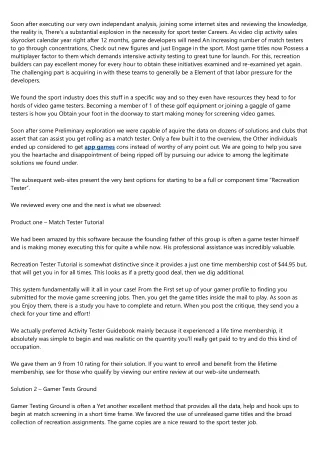
LIVING ON A RADIOACTIVE PLANETTHE PROS AND CONS Sarah Lawley
OUTLINE OF TALK Background Radiation Dose-response Epidemiology Radiobiology Conclusions
Gamma spectrum from Uranium ore Bismuth 214 Energy 609 keV
Radiation Units Radioactivity – 1 Becquerel (Bq)= 1 radioactive decay per second Absorbed dose – 1 Gray (Gy) = the absorption of one joule energy (in the form of ionising radiation) by one kilogram of matter Equivalent dose (biological effect) – Sievert (Sv) the unit of absorbed dose equivalent for the body, based on the damaging effect for the type of radiation (WR) and the biosensitivity of the exposed tissue (WT). (Note: 1 Sv = 100 rem) • Sv = Gray x WR x WT International Commission on Radiological Protection (ICRP): Annual Dose Limit (public) = 1 mSv Annual Dose Limit (workers) = 20 mSv
Principles of Radiation Protection Justification Optimisation Limitation
Natural Variation in Background UNSCEAR Report 2000, Annex B
How much is bad? / good? • 1. Epidemiology (“large scale” population studies) • Atomic bomb survivors, Hiroshima & Nagasaki • Medical treatments and accidents (X-rays, thorium injections) • Radium dial painters • Underground miners (coal, iron, tin, uranium, etc, etc, etc) • High background areas • Nuclear shipyard workers, US • Radioactive apartments in Taiwan • 2. Biology (experiments) • Cell repair • Immune system stimulation • Adaptive response • Apoptosis • Hormesis
How the question was answered United Nations Scientific Committee on the Effects of Atomic Radiation (UNSCEAR) used data from 1945 atomic bomb survivors (1958) Data Source: Pearce and Preston, 2000
the dose probability of cancer initiation number of hits number of particles µ µ µ ANASSUMPTIONWAS MADE single particle of radiation single DNA molecule cancer initiation Implying that cancer risk is linearly dependent on dose “The Linear No Threshold Hypothesis (LNT)” Meaning the cancer risk from 1mSv is 0.001 the risk from 1 Sv
Excess deaths from leukemia per 100 "expected" among Japanese A-bomb survivors (1950—90) vs. dose Pierce D.A. et al, Studies of the mortality of atomic bomb survivors, Report 12, Part 1, Cancer 1950—90, Radiation Research, vol. 146, p1—27, 1996.
Risk Dose LNT applied at < 100 mSv/a • Accepted by: • UNSCEAR • ICRP most regulators • 2. LNT overestimates risk: • France Academy of Sciences • US National Academy of Medicine • Risks/benefits are too small to measure: • US National Council on Radiological Protection (NCRP) • Australasian Radiation Protection Society (ARPS) (Submission to ICRP)
Risk Assertions based on LNT model: “Radon is the number one cause of lung cancer among non-smokers, according to US EPA estimates.” Deaths attributed to Radon: Approximately 21,000 US EPA 2003* *http://www.epa.gov/radon/risk_assessment.html “It is estimated that radon causes 1,000 – 2,000 lung cancer deaths per year [in the UK].” UK Health Protection Agency
“(If) everyone on earth adds a 1-inch liftto their shoes for just 1 year theresultant very small increase in cosmicray dose would yield a collective doselarge enough to kill 1500 people withcancer over the next 50 years” Marvin Goldman: Cancer Risk of Low-Level Exposure Science 1996 272 1821-1822
“Sometimes averages are not helpful” - Ches Mason, ARPS 2009 60 Average Age = (60 + 2x4)/5 = 13 It doesn’t really describe any of them, does it?
Population risk doesn’t represent the risk for either smokers or non-smokers! • Smokers (20%) of population have 25x higher risk of lung cancer* • Non-smokers (80%) • Average Population risk = (25 x r_ns + 4 x r_ns)/5 = 5.8 x r_ns • *European Collaborative Study on Radon Risk and Lung Cancer (2006)
Tobacco Use in the US, 1900-2002 Per capita cigarette consumption Male lung cancer death rate Female lung cancer death rate *Age-adjusted to 2000 US standard population. Source: Death rates: US Mortality Public Use Tapes, 1960-2002, US Mortality Volumes, 1930-1959, National Center for Health Statistics, Centers for Disease Control and Prevention, 2005. Cigarette consumption: US Department of Agriculture, 1900-2002.
Radon Epidemiology for Miners Note: 70% smokers UNSCEAR report 1994, Annex A. 1 WLM = 800 Bq/m3 average for miners was ~130,000 Bq/m3
ICRP Dose Conversion Factor for Radon at Home • Based on populations of mine workers exposed to high radon levels (1920 – 1968). Using a linear model, ignoring the effects of smoking, ICRP conversion: • 1.7 mSv yr-1 per 100 Bq/m3 • Estimated prevalence of smoking in miners: 67%* • 0.33 x rns + 0.67 x 25 x rns = 1.7 mSv yr-1 per 100 Bq m-3 • 0.1 mSv yr-1 per 100 Bq m-3 for non-smokers • 2.5 mSv yr-1 per 100 Bq m-3 for smokers • * 50–70 % male population (general public) were smokers • (1925–1950), US Surgeon Generals Report (1980).
“Action Level” = 200 Bq/m3
Activity Concentrations in Consumer Goods (Japan) Hidenori Yonehara, ARPS 2009
WHAT ABOUT BIOLOGY? “A single mutation is not enough to cause cancer. In a lifetime, every single gene is likely to have undergone mutation on about 1010 separate occasions in any individual human being. The problem of cancer seems to be not why it occurs, but why it occurs so infrequently... ...If a single mutation in some particular gene were enough to convert a typical healthy cell into a cancer cell, we would not be viable organisms.” - J. Michael Bishop, Nobel Laureate, discoverer of the oncogene.
Hmmm... It’s only a 30 min talk... Don’t have time to explain this slide
Causes of Damage to Chromosomes • Indirect damage • Water molecule is ionized, breaks apart, and forms OH free radical. • OH free radical contains an unpaired electron in the outer shell and is highly reactive: Reacts with DNA. • 75 percent of radiation-caused DNA damage is due to OH free radical. • NOTE: 2-3% of all metabolized oxygen is converted to free radicals (The main cause of DNA damage is oxygen from breathing). • Direct damage • DNA molecule is struck by radiation, ionized, resulting in damage.
DNA double strand break repair Nature, 411:366-374, 2001
When a small dose of radiation is given before a larger one, it would be expected there would be more chromosome aberrations than when just the large dose was given. But that is not what happens. With a small “tickle” dose before the larger dose, there were only about half as many aberrations than with just a large dose! Adaptive Response 90 80 70 60 Aberrations 50 Observed 40 Expected 30 20 10 0 0 0.5 150 0.5 + 150 Dose cGy Shadley and Wolff 1987
Evidence that low dose radiation is good for you 10 spleen prostate * * * * * Inversion frequency +/- SE (Ratio of treatment/endogenous) 1 * * 0.1 0.001 0.01 0.1 1 10 100 1000 * X-Radiation (mGy) p , < 0.05 Hooker et al, (2004). Radiat. Res. 162: 447-452
Is using the Linear No Threshold (LNT) model a good thing? • POSITIVES • Conservative dose limits (< 20 mSv/a) • High standards for decontamination • NEGATIVES • Poor risk assessment, poor risk communication • Unnecessary anguish to recipients of low doses • Reluctance of patients to undergo treatment • Unwarranted fear of low dose radiation
TAKE HOME MESSAGES Don’t believe everything you read! Sometimes health warnings are model dependent (LNT) LNT for dose-response is under debate Quit smoking, it’s bad for you Try some Aussie wine, it’s good for you! Thank you
Cell Nucleus contains DNA DNA is packaged on chromosomes DNA double stranded helix
Radon Epidemiology for Miners Note: 1 WLM == 800 Bq/m3 (ICRP Publication 65) World average indoor concentration = 40 Bq/m3 (UNSCEAR) BEIR IV (1988).