Download
1 / 10
100 likes | 268 Vues
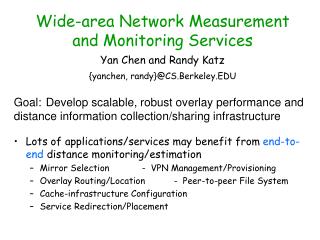
Wide-area Network Measurement and Monitoring Services. Yan Chen and Randy Katz {yanchen, randy}@CS.Berkeley.EDU. Lots of applications/services may benefit from end-to-end distance monitoring/estimation Mirror Selection - VPN Management/Provisioning

E N D
Wide-area Network Measurement and Monitoring Services Yan Chen and Randy Katz {yanchen, randy}@CS.Berkeley.EDU • Lots of applications/services may benefit from end-to-end distance monitoring/estimation • Mirror Selection - VPN Management/Provisioning • Overlay Routing/Location - Peer-to-peer File System • Cache-infrastructure Configuration • Service Redirection/Placement Goal: Develop scalable, robust overlay performance and distance information collection/sharing infrastructure
Decision/Design Procedures Dissemination Layer Federation for Sharing Layer Measurement Collection, Transformation and Storage Layer Measurement Layer Layered Architecture Application side Pull-/push- based APIs • What to measure, what tools? • Probe placement & density
Measurement Layer • Problem formulation: Given N end hosts that belong to different administrative domains, how to select a subset of them to be probes and build an overlay distance monitoring service without knowing the underlying topology? • Solution: Internet Iso-bar • Cluster of hosts that perceive similar performance to Internet • For each cluster, select a monitor for active and continuous probing • The first one for monitoring site selection and stability evaluation with real Internet measurement data • Compare with other distance estimation services: Network Distance Map, GNP
Framework of Internet Iso-bar • Define correlation distance between each pair of hosts • Apply generic clustering methods • Choose the center of each cluster as monitor • Periodically monitors measure distance among each other as well as the distance to the hosts in its cluster • Inter-cluster distance estimation dist(i,j) = dist(monitori, monitorj) • Intra-cluster distance estimation (i,j has same monitor m) dist(i,j) = (dist(i, m) + dist(j, m) ) / 2
Correlation Distance • Network distance based • Using proximity: dij = measured network distance(pij) • Using Euclidean distanceofnetwork distance vector: Vi = [pi1, pi2, …, pin]T • Using cosine vector similarityofnetwork distance vector: • Geographical distance based • Using proximity
Evaluation Methodology (I) • Experiments with NLANR AMP data set • 119 sites on US (106 after filtering out most off sites) • Traceroute between every pair of hosts every minute • Clustering uses daily geometric mean of round-trip time (RTT) • Evaluation uses daily 1440 measurement of RTT • Raw data: • 6/24/00 – • 12/3/01
Summary of 80th percentile relative error for various distance estimation methods • Static approaches, like GNP, performs better in term of overall prediction accuracy • But very expensive in computation and communication cost for update, can’t capture congestion/path outage
Evaluation II: Keynote Web Site Perspective Benchmarking • Measure Web site performance from more than 100 agents on the Internet • Heterogeneouscore network: various ISPs • Heterogeneousaccess network: • Dial up 56K, DSL and high-bandwidth business connections • 40 most popular Web servers for benchmarking (KB40) • TCP initial connection time, every 15 mins • 11/13/01 – 12/13/01 • Problem: how to reduce the number of agents and/or servers, but still represent the majority of end-user performance?
Keynote Agent Locations • America (including Canada, Mexico): 67 agents • 29 cities: Houston, Toronto, LA, Minneapolis, DC, Boston, Miami, Dallas, NY, SF, Cleveland, Philadelphia, Milwaukee, Chicago, Cincinnati, Portland, Vancouver, Seattle, Phoneix, San Diego, Denver, Sunnyvale, McLean, Atlanta, Tampa, St. Louis, Mexico, Kansas City, Pleasonton • 14 ISPs: PSI, Verio, UUNET, C&W, Sprint, Qwest, Genuity, AT&T, XO, Exodus, Level3, Intermedia, Avantel, SBC • Europe: 25 agents • 12 cities: London, Paris, Frankfurt, Munich, Oslo, Copenhagen, Amsterdam, Helsinki, Milan, Stockholm, Madrid, Brussels • 16 ISPs: PSI, Cerbernet, Oleane, Level3, ECRC, Nextra, UUNET, TeleDanmark, KPNQwest, Inet, DPN, Xlink, Telia, Retevision, BT, Telephonica • Asia: 8 agents • 6 cities: Seoul, Singapore, Tokyo, Shanghai, Hongkong, Taipei • 8 ISPs: BORANet, SingTel, IIJ, ChinaTel, HKT, Kornet, NTTCOM, HiNet, • Australia: 3 agents • 3 cities: Sydney, Wellington, Melbourne • 3 ISPs: OzeMail, Telstra-Saturn, Optus
Summary of 80th percentile relative error for Internet Iso-bar distance estimation • Omit other methods due to data limitation • Accuracy not as good as NLANR, but still acceptable