Download
1 / 26
260 likes | 496 Vues
C6 - Supply/Demand Market Model. Changes in Market Conditions using Demand and Supply Concepts Analysis - elasticities . Expanded Market Framework Derived Demand and Supply Marketing margin. Simple Market Model. Qualitative implications for equilibrium Price and Quantity

E N D
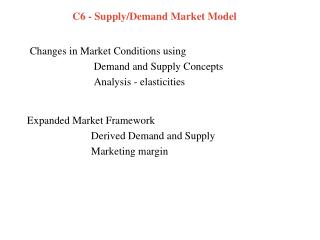
C6 - Supply/Demand Market Model Changes in Market Conditions using Demand and Supply Concepts Analysis - elasticities Expanded Market Framework Derived Demand and Supply Marketing margin
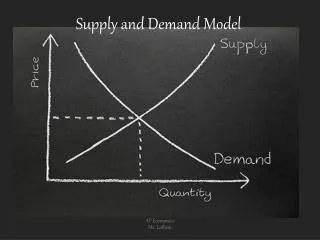
Simple Market Model Qualitative implications for equilibrium Price and Quantity Inferences – Is S/D responsible for change in conditions? Demand and Supply shifts Quantitative analysis using elasticities (own, cross, income)
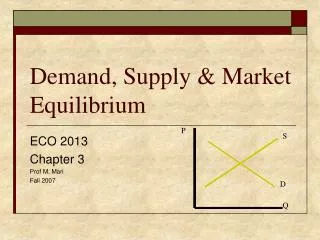
P D2 S D1 Q Simple Market Model - Demand shifts P & Q move in same direction
P S1 D S2 Q Simple Market Model - Supply shifts P & Q move in opposite direction
Unterschultz, J.R., Scott R. Jeffrey and Kwamena K. Quagrainie., Value-Adding 20 Billion by 2005: Impact at the Alberta Farm Gate., AARI Project #980842., Department of Rural Economy., University of Alberta, 2000
Unterschultz, J.R., Scott R. Jeffrey and Kwamena K. Quagrainie., Value-Adding 20 Billion by 2005: Impact at the Alberta Farm Gate., AARI Project #980842., Department of Rural Economy., University of Alberta, 2000
Price Analysis Using Elasticities - Change in Demand - Appendix A From Schrimper: Demand Elasticities for Beef (-0.62 and 0.39) Price increase = 30%; Income increase = 1% Change in demand = (-0.62)(0.30) + (0.39)(0.01) = - 0.182 (- 18%)
Change in Supply From Schrimper: Supply Elasticity for Corn (0.34 to 1.59) Price increase = 30%; Change in supply = (0.34)(0.30) = 0.102 (10%) US expected production 2013 = 14 Billion bu (356 Million tonnes) 12.5 Bbu in 2010
Change in Equilibrium Price . Demand Shifter: (change in income) Equilibrium Condition: (supply = demand)
Analysis of the Economic Importance of Changes in Soybean Use. Nicholas E. Piggott, Michael K. Wohlgenant, and Kelly D. Zering, North Carolina State University January 31, 2000
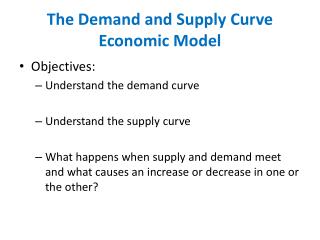
Expanded Framework • Multiple levels of marketing system • Derived demand • retail (primary) => farm (derived) • marketing margin • marketing activities (cost) • links consumer and producer behaviour • deduce how retail shifts impact farm demand
Derived Demand Linear Marketing Margin P Retail (Primary) Demand Dr Derived (farm) Demand Df Q
Assumptions: Linear Marketing Margin • Inputs: used in fixed proportions • Retail Price = farm price + marketing inputs • constant returns - no economies of scale (marketing activities) • Prices (marketing inputs) • fixed/constant => perfectly elastic supply (competitive markets) • Margin • temporal invariance Implications • fixed absolute margin • Price elasticity - market levels
P Dr (P/Q)r = 1 Df (P/Q)f Elasticity and Derived Demand Demand elasticity at retail higher than farm level
Shifts in demand or margin • Shift in retail demand – BSE crisis • Farm level demand shifts down • Marketing margin constant P Dr Df
Shifts in demand (margin) • Increase in marketing costs (new regulations) • Farm demand (derived) shifts downward P Dr Df
Alternative Models • Margin varies with quantity (proportional markup) • Decrease in marketing costs – as output expands P Dr =1 Df Q Demand elasticity at retail still higher than farm level
Derived Supply Farm supply (primary) Retail supply (derived)
Derived Supply and Demand P DR SR PR SF DF PF Q* Quantity
Shift in Demand DR P SR DF PR SF PF Q*
Increase in Marketing Margin P DR SR PR SF DF PF Q* Q
An Extension - Appendix B Some commodities have alternative uses Soybeans: US output 3.1 Billion bushels (2011) (0.9 Bbu - 1965) Crush yields (60 lb bu) 47 lb meal (78%) and 11 lb oil Demand for beans = F(demand for meal and demand for oil) Total demand for beans (kinked demand function)
CBOT Soybean Price (2003 – 2011) $ 13 $ 6
Deriving Total Demand - Kinked Demand Function P S D1 P* TD D2 Q