Wireless Telecommunications Industry Analysis: Market Dynamics and Competitive Strategies
This comprehensive report analyzes the wireless telecommunications industry, focusing on key players like Verizon, AT&T, Sprint, and T-Mobile. It discusses competition, pricing strategies, and consumer demographics, highlighting the growing demand for advanced data services. The report explores market concentration, technological advancements from 1G to 4G, and the implications of network externalities and tacit collusion. Additionally, it outlines investment opportunities and strategic recommendations to navigate the rapidly evolving market landscape.

Wireless Telecommunications Industry Analysis: Market Dynamics and Competitive Strategies
E N D
Presentation Transcript
Wireless Telecommunication Carriers Tillman Elser, Isabelle Nunberg, Nikkita Mehta, Julie Greenberg
Agenda • The Industry • General Background • Consumers • Main Players • Competition • Pricing Strategies • Bundling and Versioning • Three Part Tariff • Network Externalities • Tacit Collusion • Penalty Pricing • Discounts • Cell phone pricing Recommendations • Investments
The Industry - General Background - Consumers - Main Players - Competition
Primary Products • Wireless voice communication • Text Messaging services (SMS) • Advanced PCS (personal communication services) • Other data services • Other wireless services
Industry Snapshot • Lower pricing -> competitive advantage over wired services • Consumers embracing newer/more expensive technology • Retail presence decreasing in importance IBISWorld
Primary Consumers • Corporate clients (15%) • Stable market characterized by long term contracts and predictable patterns of usage • Most concerned with reliability (voice) and speed (data) • Big target for 4G technology • Small/Medium Businesses (30%) • Laptop data plans and fixed mobile services attractive to this market • General consumer/residential clients (55%) • Most price sensitive • Demand growing fastest in this group
Differentiation among consumers vs • Heterogeneous preferences for cell phone usage • High use • Low use • Focus on Data • Focus on Voice • Focus on Text
Expenses Breakdown • 24.8% - Cost of service • 14.5% - Depreciation • 12.5% - Equipment Purchases • 8.4% - Wages • 5.9% - Advertising • 6.7% - Rent/Utilities fees • 6.5% - Profit • ~20% other expenses
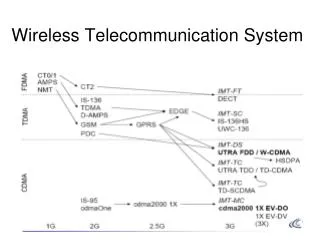
Network Technology • 1G • Analog, usage stopped in 2008 • 2G • Basic voice and data functionality • Popularity declining as newer standards develop • 14.4Kb/s • 2.5G • Stepping Stone from 2G to 3G • 50-150Kb/s speed • Wireless Application Protocol (WAP) mobile Internet as well as MMS • Most advanced iteration of 2.5G is the EDGE network (AT&T/T-Mobile) • 200-1000Kb/s
Network Technology (cont.) • 3G • Current standard among smartphones • Beginning to assume market dominance from 2G and 2.5G • Speeds of 300-600Kb/s • 3.5G • Middle ground between 3G and 4G • Speeds up to 14.4Mb/s • AT&T/T-Mobile • 4G • Epitomizes shift from voice to data among telecommunications carriers • Conflict between WiMax (Sprint) and LTE (Verizon) standards • Speeds up to 100Mb/s for mobile devices (1Gb/s for stationary devices)
Market Concentration • Trends of M&A • Method to gain subscribers and coverage • Saturated market: harder to build new customer base • Economies of scale • Higher margins and available capital enable firms to invest in their networks and services
Market Concentration • Top 4 Firms Market Shares: • Verizon Wireless: 33.4% • AT&T Inc.: 31.2% • Sprint Nextel Corporation: 16.2% • Deutsche Telekom AG (T-Mobile): 11.0% • CR4 = 91.8 • HHI = 2472.44
Verizon Wireless • 33.4% of market (market leader) • Part of Verizon Communications– VW contributes almost 2/3 of revenue • Originally merger of three companies • Acquired Alltel in 2009 to give VW largest market share in industry • Now transitioning to 4G LTE • Revenue growth of 11.7% annually over past 5 years • In 2011, expected to generate $66.1 billion in revenue and net income of over $4.4 billion
AT&T Inc. • 31.2% of market • Largest market share until Verizon-Alltel merger • Started as joint venture called Cingular Wireless • In 2006, AT&T acquired both companies and became AT&T Inc. • AT&T wireless contributes to ½ of company revenue • Plans to acquire T-Mobile within next 12 months • Problem of congestion on data networks • Revenue growth of 10.3% annually over past 5 years • In 2011, expected to generate $61 billion in revenue and net income of $16.5 billion
Sprint Nextel Corporation • 16.2% of market • Sprint and Nextel merged in 2005 • Only major company losing subscribers • Backs WiMax instead of LTE for 4G network • Annual revenue decline of 4.1% and has failed to turn a profit since 2006
T-Mobile • 11% of market • Brand of Deutsche Telekom AG in US • First wireless carrier to offer Android phones • Large carrier of WiFi with T-Mobile Hot Spots • Plans for AT&T to acquire T-Mobile • In 2011, will generate $28.2 billion in revenue and net income of $1.8 billion
Competition • HIGHEST in whole telecommunications sector • WHY? • Churn rate of 1.5% to 3.5% per month • Types: • Price • Service offerings & quality of service • Product innovation • Network dependability and call quality • Marketing strategies • Geographic coverage
Competition:Pricing • Firms all offer similar products, coverage, and services price competition is vital • Try to undercut competition • Discounts, network externalities, etc. • Partly enabled by recent M&A activity by improving firms’ economies of scale
Competition:Service Offerings & Quality of Services • Service becomes important weapon in the industry as customers increasingly value reliability and attention • High investment in upgraded technologies and networks • Customer service becomes vital in gaining customer loyalty and reducing churn rates • Expansion of service offerings: “one-stop” bundles • Telecommunications Act of 1996
Competition:Product Innovation • New technologies incredibly useful in increasing usage, margins, and customer base • Short life cycles for products and applications • New technology includes: • E-mail • GPS mapping • TV feeds • E-commerce . . . • 3G 4G
Competition:Marketing Strategies • Promotional tactics • Rebates, discounts, etc • Advertising • Supply side: Combative advertising • Mature market; goal is to shift consumer demand toward advertising firm but not expanding consumer demand • Demand side • Persuasive: alters consumers tastes based on service providers’ attributes, strengthens barriers to entry especially in industry with economies of scale • Complementary: appeals to “social prestige” with new phones, appeals to attributes complementary to use (coverage, overage, etc.)
Competition:Geographic Coverage • Ultimate goal: maximum US nationwide coverage • Enables furthering economies of scale and higher efficiency • Over 277 million Americans (approx. 91%) can choose between three or more providers while 250 million of those Americans (approx. 82%) can choose between only top four
External Competition • Mobile virtual network operators (MVNOs) • Companies that purchase airtime from a major wireless network then resell it with their own logo • Increasing as communications and media leaders have recognized potential growth • Mobile strategies developed by Comcast and Time Warner Cable • Google looked into bidding in 700MHz auction in 2008
Barriers to Entry • Barriers to entry are high and increasing primarily due to… • Regulating spectrum scarcity • High costs • Market saturation
Barrier:Spectrum Scarcity Regulations • Spectrum scarcity refers to a finite number of companies being able to operate cellular/PCS services with a designated geographic location and frequency • Distributed through licenses within a specified area • Closed to new entrants until next auction • Cost at time of auction is high; over $19 billion was spent in 2008 700 MHz auction
Barrier:High Costs • High initial costs • Base stations, towers, and other necessary infrastructure reaches the billions • Costs of R&D and other investments • Dependency on product innovation and up-to-date technologies • Marketing strategies
Barrier:Market Saturation • Existing firms already established their strong positions • Cost advantages due to economies of scale • Ability to spread expenses over large customer base • “one-stop” bundles differentiate from pure wireless providers and reduce churn rates • Slowing growth in customer base
Pricing Strategies - Bundling and Versioning - Three Part Tariff - Network Externalities - Tacit Collusion - Penalty Pricing - Discounts - cell phones
Bundling and Versioning • Feature bundling on cell phones -> facilitates feature bundling on contracts • Customers pushed onto smart phones • Increases access to additional features • Versioning • Family plan vs Individual plan • Extensive bundling seen in cell phone plans • Considerable variance between companies • Common themes: Avoid pure bundling, target heterogeneous preferences
AT&T • Focus on mixed bundling • Most profitable bundles listed more prominently • In some cases, no price difference between bundled and non bundled services • Customer ‘opts-in’ to services
Verizon • Pure and mixed bundling • Similar services grouped together • Customer forced to ‘opt-out’ of some services • Fewer options than AT&T, but still many additional services offered • Minutes and text packages offered as initial service bundles • Can also add text package after choosing minutes
T-Mobile • Lower utilization of mixed bundling, focus on pure bundles • Customer required to opt-in to several free services • Huge number of bundles -> confusion pricing
Sprint • Focus on pure bundling • Search obfuscation used more prominently (‘premium data add-on) • Fewest additional service options
Three-part tariffs • Monthly fee and per minute fee • Now, mostly three-part tariffs: monthly fee with included minutes but high overage fee • Customers choose three-part tariff over two-part tariff because of flat-rate bias • Most customers underestimate usage (use only half of minutes allowable on average) • Those that do exceed allowance, exceed by 40% on average
Confusion Pricing • Many versions so consumer surplus extracted from those less willing to search for correct plan • Customers underestimate uncertainty about usage (overconfidence) by 81% and underestimate volatility of usage (projection bias) by 57% • When first signing up, average customer underestimates usage by 40% • Companies gain an average of $60 per customer • Slow to correct mistake and switch plan • AT&T “rollover” plan targets sophisticated consumers who understand that usage changes monthly
Network Externalities • Companies create network externalities as an incentive to gain new customers • Free texting within Verizon network • Free minutes within all networks • Only significant after critical mass reached • Customers benefit from others on the same network • The greater the size of the network, the greater the benefit to user
Tacit Collusion • How does it work? • Industry is an oligopoly • Top four firms dominate almost the entire market • Homogenous products • Same phone (e.g. iPhone from AT&T or Verizon?), data services (text, e-mail, etc) • Agreement on price is easier to come by and cheating is easier to catch • Nondurable goods • Less incentive to cheat because it is a one-time sale product rather than a product from which sellers could gain a series of sales
Tacit Collusion:Pre-Announced Rate Changes • Service providers typically pre-announce rate changes they plan on implementing • Advanced notice gives competing firms time to respond • Can test the market and competitors
Tacit Collusion:Infrequent High Changes in Rates • Rate changes in the industry have been high and infrequent, yet coordinated across all four firms • FOCUS: Text Messages • Supply is almost unlimited so in a competitive market prices should decrease not increase over time • Since 2005 price per text has doubled. IBISworld • Service providers do not claim that these increases were driven by higher costs so other methods must be at work. • Doubling of prices pushes prices from inelastic portion of demand curve to elastic portion to capture unrealized revenue
Penalty Pricing: The “Typical” Consumer • Barriers of Adoption • Unpredictability of use • Profit Margin due to over and under usage. Unattentive Overconfident Underestimates
The Fees: Sources: VerizonWireless.com ATT.com Sprint.com T-mobile.com
About 16.5 million people exceed their cell phone minutes every month in the US (according to cellknight.com) • In 2005, Minute-Watch.com show that if the average family took their cell phone overage charges and invested them in a standard index mutual fund (yielding 10.65%) for 22 years, they would have over $19,500 - enough to send a child to many state colleges for two years. An Idea…Numbers wise
Discounting • Penetrative • Competitive • Permanent
Verizon vs. AT&T in Ithaca • Advertized coverage • All claim GREAT reception. • What drives consumers to pick one over the other? T-Mobile(above) AT&T(below) Sprint(above) Verizon(below)
Peak and Off-Peak Pricing • Incentive to reduce the quantity of users on the network at high times and spread them out over other times which saves them infrastructure costs and prevents overloads • Started out as different rates for different times • Evolved to the free nights and weekends
Cell Phones as a Pricing Strategy • Bundling • Tying • Contract • Specific plans/add-ons • Inter-temporal price discrimination • Network Externalities • Subsidized