Evaluation Research Step by Step
Evaluation Research Step by Step. Step 1 – Formulate Research Question Step 2 – Operationalize Concepts Valid and Reliable Indicators Step 3 – Decide on Sampling Technique Draw Sample Step 4 – Select Data Collection Technique Collect Data Step 5 – Analyze Data

Evaluation Research Step by Step
E N D
Presentation Transcript
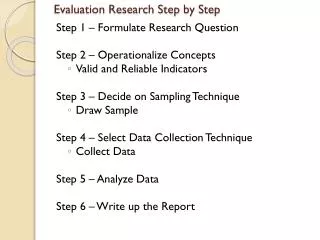
Evaluation Research Step by Step Step 1 – Formulate Research Question Step 2 – Operationalize Concepts • Valid and Reliable Indicators Step 3 – Decide on Sampling Technique • Draw Sample Step 4 – Select Data Collection Technique • Collect Data Step 5 – Analyze Data Step 6 – Write up the Report
Evaluation Research Step by Step • Steps 1 and 2 have already been covered in previous power points.
Step 3 - Drawing A Sample • Identify Population • Decide on either Random (probability) or Nonrandom (nonprobability) Sampling Technique
Sampling • Terms to Know • Population: Total group to be studied • Case: Units to be sampled • (individual, county, etc.) • Sample: Group to be interviewed • Sampling Frame: List from which we obtain the sample • (a roster from a class, or a directory from an organization, etc.)
Sampling • Types of Sampling Designs • Simple Random Sampling • Single number assigned to each case • Table of random numbers is used • Assumes a complete list of the population • Laborious • Systematic Sampling • Every “x”th element from a sample frame is selected • Determine size needed • Take random start • Select every “x”th element • Probability Proportionate to Size (PPS) • Larger ones (clusters) have greater probability of being selected
Sampling • Types of Sampling Designs • Stratified Sampling • Sample separately from different key categories Example: Determine number needed from each racial/ethnic group (this number should be approximately the same for each group). Total # # Needed African Americans 300 100 Hispanics 200 100 Asian Americans 100 100 Anglo Americans 500 100 Total Population 1000 400 Sample separately from each group taking proportion needed to get approximately equal numbers from each racial/ethnic group African Americans Need 50% sample Hispanics Need 50% sample Asian Americans Need 100% sample Anglo Americans Need 20% sample
Sampling • Types of Sampling Designs • Multistage Cluster Sampling • Used when don’t have a complete list • Sample in stages (units within units) Example of multistage random sample: (1) Universities USU U of U BYU (4) Classes Landscape, Architecture and Environmental Planning (LAEP) (2) Colleges Agriculture Engineering Theory of Design Plants, Soils and Climate Department (PSC) Landscape Materials (3) Departments Molly Trish (5) Students Jim
Determining Sample Size N = D2 Appendix 2Recommended sample sizes for two different precision levels N + 1 .9604 Sample Size +/- 5 % +/- 10% Sample Size +/- 5 % +/- 10% Population Size Population Size 10 10 275 163 74 15 14 300 172 76 20 19 325 180 77 25 24 350 187 78 30 28 375 194 80 35 32 400 201 81 40 36 425 207 82 45 40 450 212 82 50 44 475 218 83 55 48 500 222 83 60 52 1000 286 91 65 56 2000 333 95 70 59 3000 353 97 75 63 4000 364 98 80 66 5000 370 98 85 70 6000 375 98 90 73 7000 378 99 95 76 8000 381 99 100 81 51 9000 383 99 125 96 56 10,000 385 99 150 110 61 15,000 390 99 175 122 64 20,000 392 100 200 134 67 25,000 394 100 225 144 70 50,000 397 100 250 154 72 100,000 398 100
Nonrandom Sampling • Availability or Convenience Samples • Select those who are available or convenient • Quota Samples - select representative size of different types of respondents • Purposive Samples • Need specific types of information – select those who will have that information • Theoretical Samples • Theory specifies characteristics of your units of analysis. For instance, a theory of inequality may require you to have respondents at different levels of income. • Snowball Samples • Hard to Reach – Hard to identify populations
Nonrandom – Nonprobability Sampling • Availability or Convenience Samples • Sample classrooms of students here on campus because they are available and convenient • Availability or Convenience Using Quota • Sample classrooms of students here on campus because they are available and convenient, BUT • Select classes with approximately equal numbers of men and women because there are approximately equal numbers in university
Nonrandom - Nonprobability Sampling • Purposive Samples • Select Key Informants who can provide information you need • If you want to look at community leader’s attitudes toward homeless then you would select • Law enforcement • Civic leaders/policy makers • Heads of social service agencies • Three Guidelines • Knowledge about the culture/situation or experience • Willing to talk • Representative of the range of points of view • Two Tests • Completeness – overall sense of what they think • Saturation – not hearing anything new
Nonrandom – Nonprobability Sampling • Theoretical Samples • Theory specifies characteristics of your units of analysis • Example – Research on parent/teacher interaction using Expectation States Theory. • Research Questions - How do parents and teachers interact? How is interaction influenced by race and social class of parent? How are expectations influenced by socioeconomic characteristics of parents. • Theory specifies that as inequality between parent and teacher increase, so does “expert power” of teacher – and conformity of parent.
NonRandom- Nonprobability Sampling • Snowball Samples • Key Informant or GATEKEEPER who then refers you to someone else • Sample size “snowballs” or increases rapidly. • Used when you are working with groups that are reluctant to be studied, and you need to gain confidence of group members. • Example of groups where snowball samples are used– Gang members, Alcoholics anonymous members, etc.
Ways that People Generally GatherInformation – Data Collection Techniques • Participant Observation • Content Analysis • Surveys/Intakes/Questionnaires • This excludes non-empirical ways of collecting information (intuition, inspiration, 6th sense etc.)
Types of Data Collection Techniques Paired with Most Likely Sampling Technique • Participant Observation – generally uses nonrandom sample. • Content Analysis – generally uses nonrandom sample. • Surveys/Intakes/Questionnaires – generally uses random sample. • This excludes non-empirical ways of collecting information (intuition, inspiration, 6th sense etc.)
Contact Information • Dr. Carol Albrecht • Assessment Specialist • 979-777-2421 • Carol.albrecht@usu.edu