Florida Quarterly Meeting Root Cause Analysis
530 likes | 712 Vues
Florida Quarterly Meeting Root Cause Analysis . January 12, 2011 Christy Hormann, MSW, CPHQ Project Leader-PIPs Don Grostic, MS Associate Director Research & Analysis Team. Objectives. Learn about root cause analysis and discuss why it is important.

Florida Quarterly Meeting Root Cause Analysis
E N D
Presentation Transcript
Florida Quarterly Meeting Root Cause Analysis January 12, 2011 Christy Hormann, MSW, CPHQ Project Leader-PIPs Don Grostic, MS Associate Director Research & Analysis Team
Objectives • Learn about root cause analysis and discuss why it is important. • Obtain tools to assist your organization in conducting root cause analysis. • Review PIP documentation requirements for Activity VII. 2
Root Cause Analysis What is a root cause? • A root cause is the main reason(s) why something happened or did not happen. • When resolved, it should prevent a recurrence of the problem and improve outcomes. 3
Root Cause Analysis A way of looking at unexpected events and undesirable outcomes to determine all of the underlying causes and recommend changes that are likely to improve them. 4
Root Cause Analysis • Also known as causal/barrier analysis. • The causes/barriers identified are the reasons (root causes) why the study indicator results are not meeting performance standards. 5
Root Cause Analysis A symptoms-focused approach: “An error occurred. It was because workers are careless. We need to train them to be more careful.” www.nasa.gov 6
Root Cause Analysis Focusing on the root cause: “There was a defect in the system. People are only part of the process. We need to find out why the error occurred and implement actions so it won’t happen again.” www.nasa.gov 7
Root Cause Analysis Root cause analysis should: • Primarily focus on systems and/or processes. • Identify changes that can be made in systems and/or processes. 8
Root Cause Analysis The problem must be fully understood before action is taken to fix it. 10
Root Cause Analysis Data analysis Root cause analysis Develop and implement solutions 11
Root Cause Analysis 1. Will help the organization understand the barriers to achieving desired outcomes. 2. Interventions can be streamlined and focused to address the barriers. 3. PIP documentation requirement (critical element). 12
The overall goal is to achieve improvement in the care and services provided to members. 13
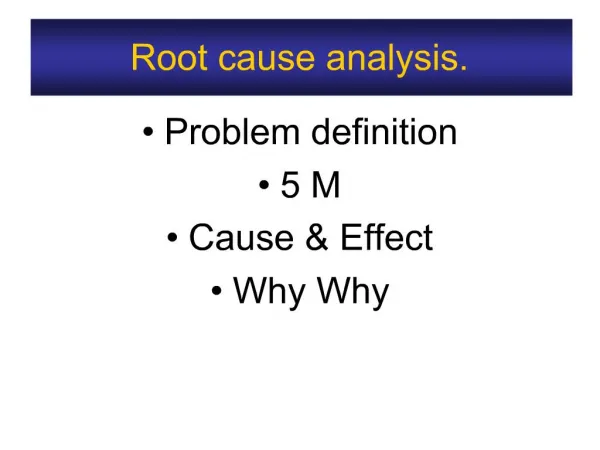
Root Cause Analysis Methods: • Brainstorming • Five whys 15
Brainstorming “Brainstorming is a group creativity technique designed to generate a large number of ideas for the solution of a problem.” http://en.wikipedia.org 16
Brainstorming • Everyone involved in the process can participate. • Team generates as many ideas as possible. • Can be done in a short period of time. 17
Brainstorming • Promotes creativity and participation. • Focus on quantity of ideas. • Team members should not criticize ideas. 18
Brainstorming “We need good ideas and we need them nowSo put your heads together and we’ll write them downThere’s no bad ideas when you’re brainstorming.” 19
Five whys • Simple problem-solving technique. • Gets to the root of the problem quickly. 20
Five whys Example Problem Statement: You are on your way home from work and your car stops in the middle of the road.1. Why did your car stop? - Because it ran out of gas.2. Why did it run out of gas? - Because I didn't buy any gas on my way to work.3. Why didn't you buy any gas this morning? - Because I didn't have any money.4. Why didn't you have any money? - Because I lost it all last night in a poker game.5. Why did you lose your money in last night's poker game? - Because I'm not very good at "bluffing" when I don't have a good hand. http://www.isixsigma.com 21
Root Cause Analysis Ways to incorporate member or provider input: • Surveys • Focus Groups 22
Surveys • Good for assessing satisfaction. • Usually high level. • Survey design should be considered. 23
Focus Groups • Obtain perceptions, opinions, and attitudes. • Direct dialog with participants. • Useful for dissatisfaction and establishing potential solutions. 24
Root Cause Analysis Tools: • Process Map/Flow Chart • Fishbone Diagram • Scatter Diagram • Pareto Chart • Run Chart 25
Process Map / Flow Chart A process map/flow chart is a pictorial representation that outlines all of the steps in a process. 26
What is the Value of a Process Map? Provides a picture of the process. Allows teams to agree on the process steps. Examine which steps may impact the process performance. Serves as a training tool to understand the complete process. Allows you to analyze order of the steps. 27
Basic Flow Chart Shapes Start or end Process step Decision point No Yes 28
Flow Chart Analysis Analyze flow chart of actual process. Analyze flow chart of best (ideal) process. Take steps to eliminate the differences and close the gaps. 30
First Things First Before you can improve a process, you need to know how it works. Listen to all the members of your team, especially those who are the closest to the process. Share improvement ideas. Try them. 31
Keep At It If at first you don’t succeed, try again. Look at others who perform the process well. Borrow ideas. Try again. Keep going. 32
Fishbone Diagram • Also known as a cause and effect diagram. • Explore many possible causes of a specific problem. • Can help establish a common understanding of the problem. 33
Fishbone Diagram Example 34
Scatter Diagram • A visual display of data. • Shows the association between two variables. • Illustrates the strength of the correlation between variables. • Does not prove a causal relationship. 35
Scatter Diagram Example 36
Pareto Chart • A bar chart. • Bars rank in descending frequency of occurrence. • Use when you are studying more than one variable. 37
Pareto Chart • Can show where improvement should be focused. • 20 percent of bars should show 80 percent of problem. The 80/20 rule. • Separates the “vital few” from the “useful many.” 38
Pareto Chart Example 39
Run Chart • Displays data over time. • Way to observe patterns. • Depicts how well or poorly a process is performing. 40
Run Chart • Will show if a process is changing over time. • Can evaluate to identify meaningful trends or shifts. 41
Run Chart Example 42
PIP Documentation Requirements • Activity VII: Assess Improvement Strategies • Four evaluation elements (1 critical) 43
Activity VII • Evaluation Element #1 (critical): Interventions should be related to causes/barriers identified through data analysis and quality improvement processes. • The quality improvement process used to identify causes/barriers must be documented in the PIP submission. 44
Activity VII • Evaluation Element #2: System changes that are likely to induce permanent change. • The PIP should include changes that will affect the system/process. 45
Activity VII • Evaluation Element #3: Revised if the original interventions are not successful. • If the PIP does not show improvement, interventions should be revised or new interventions added. • Causal/barrier or root cause analysis should be completed regularly throughout the PIP cycle. 46
Activity VII • Evaluation Element #4: Standardized and monitored if interventions are successful. • When the PIP has demonstrated success, interventions should be standardized and monitored. 47
Activity VII 48