Download
1 / 34
340 likes | 432 Vues
Explore the potential of utilizing high-resolution local-scale models initialized with LAPS and STMAS for improved aviation forecasts within a few hours. Learn about the benefits, solutions, and advancements in data assimilation systems for better predictive accuracy.

E N D
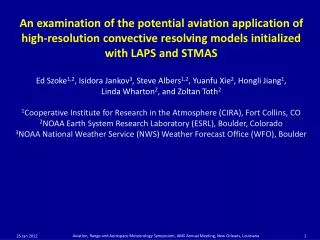
An examination of the potential aviation application of high-resolution convective resolving models initialized with LAPS and STMASEd Szoke1,2, Isidora Jankov3, Steve Albers1,2, Yuanfu Xie2, Hongli Jiang1, Linda Wharton2, and Zoltan Toth21Cooperative Institute for Research in the Atmosphere (CIRA), Fort Collins, CO 2NOAA Earth System Research Laboratory (ESRL), Boulder, Colorado3NOAA National Weather Service (NWS) Weather Forecast Office (WFO), Boulder Aviation, Range and Aerospace Meteorology Symposium, AMS Annual Meeting, New Orleans, Louisiana
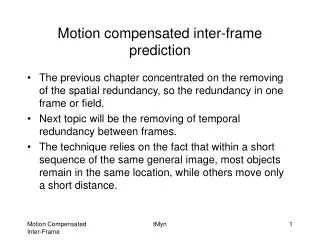
Goal: Making better forecasts in the next few hour • time frame • Trying to fill the gap between extrapolation and spin-up (and resolution) issues in the operational models • Potential solution: high-resolution (in time and space) “local-scale” model run from a high-resolution analysis • Can a model initialized with LAPS/STMAS be a part of the solution? Aviation, Range and Aerospace Meteorology Symposium, AMS Annual Meeting, New Orleans, Louisiana
What are LAPS & STMAS? • LAPS = Local Analysis and Prediction System • An analysis system that has been part of NWS at the WFO-scale and available on AWIPS since late 1980s • Philosophy from the beginning was to utilize all available data • Will be part of AWIPS-2 at 2.5 km horizontal grid resolution • Is a full 3-D analysis that can be used to initialize a model • Users: in addition to NWS, many private users around the world • Some use LAPS to start a forecast model • STMAS = Space and Time Multiscale Analysis System • Next generation analysis system to LAPS Aviation, Range and Aerospace Meteorology Symposium, AMS Annual Meeting, New Orleans, Louisiana
Why LAPS/STMAS? Current operational data assimilation system has limitations and improvement is necessary • Lack of initialization on convective scales (0-3h, needed for WoF, CI) • Solution: LAPS Hot-start • Lack of balance on convective scales • Solution: Multiscale analysis with proper balances at different scales (STMAS) • Use of observations on fine scales • Solution: multiscale approaches of LAPS and STMAS • Skill comparable with that from cutting edge international systems • Solution: new ideas and methodologies tested and transferred into operational systems Aviation, Range and Aerospace Meteorology Symposium, AMS Annual Meeting, New Orleans, Louisiana
Why STMAS as an improvement to operational LAPS? • STMAS uses a multigrid technique • Combining the advantages of LAPS analysis and other modern data assimilation techniques • Multiscale(advantage from LAPS) • Hotstart(advantage from LAPS) • Variational and ensemble (advantage from 3-4DVAR and EnKF) • Reducing their limitations • Balance (both LAPS and 3DVAR) • Covariance (LAPS) • All data source in a unified balance analysis (LAPS) Aviation, Range and Aerospace Meteorology Symposium, AMS Annual Meeting, New Orleans, Louisiana
Why STMAS (continued)? • Current data assimilation systems have difficulty in testing/developing cutting edge techniques, e.g., a multigrid technique and hotstart • LAPS/STMAS provides a platform for developing future NOAA data assimilation systems for balanced, multiscale and hot-start analysis • LAPS/STMAS is also portable and efficient in high resolution, low latency for on-site local, regional, and global applications meeting the societal needs Aviation, Range and Aerospace Meteorology Symposium, AMS Annual Meeting, New Orleans, Louisiana
A multigrid approach: STMAS multiscale analysis Long waves Short waves Sequence of 3-4DVARs with proper balances Variational analysis simulating LAPS objective analysis Standard 3-4DVAR With a band covariance A Space–Time Multiscale Analysis System: A Sequential Variational Analysis Approach Y. Xie, S. Koch, J. McGinley, S. Albers, P. E. Bieringer, M. Wolfson, M. Chan, Monthly Weather Review Volume 139, Issue 4 (April 2011) pp. 1224-1240 Possible ensemble Filter application Aviation, Range and Aerospace Meteorology Symposium, AMS Annual Meeting, New Orleans, Louisiana
Relation between STMAS and LAPS STMAS In situ, radar, satellite, cloud analysis balance and constraints In one variational analysis Ultimately Forecast Temporarily Wind analysis Temp/Ht analysis Humidity analysis Cloud analysis balance LAPS Aviation, Range and Aerospace Meteorology Symposium, AMS Annual Meeting, New Orleans, Louisiana
LAPS Hot-start: a key to model start-up • Allows the model to maintain convection from the LAPS (and STMAS) analysis • Yielding better 0 to 2 hour forecasts • Hot-start components • Vertical velocity/horizontal divergence • Temperature/height adjustment • Hydrometeor assimilation • Consistent water vapor fields Aviation, Range and Aerospace Meteorology Symposium, AMS Annual Meeting, New Orleans, Louisiana
FH FL LAPS HOT START INITIALIZATION Three-Dimensional Cloud Analysis METAR + FIRST GUESS Aviation, Range and Aerospace Meteorology Symposium, AMS Annual Meeting, New Orleans, Louisiana
Some examples • Case 1: unexpected outflow passage at DFW • Tricky case of a thunderstorm outflow accelerating southward with a significant wind shift at the Dallas airport in the midst of a drought on 11 Aug 2011 • Ended the 100o streak just short of the record • STMAS and LAPS model forecasts are shown • Model details • 3 km horizontal grid resolution • WRF model • Initialized with STMAS or LAPS 3-D analysis and hotstart Aviation, Range and Aerospace Meteorology Symposium, AMS Annual Meeting, New Orleans, Louisiana
Anunexpectedoutflowcamechargingsouthacross the area, droppingtemperatures and changing wind direction. Thunderstormswerealsonearby. The max temperatureturned out to be 97o, but fellinto the 80s for much of the afternoon. Notethat 100 oF = 40 oC. Dallas-Fort WorthAirportobservations (notethat the initial wind shiftinto the east was weak, followed by a strong wind shift to the northat 1907z. KDFW 111914Z 36026G37KT 10SM SQ FEW055 SCT090 BKN150 BKN250 31/20 A2990 RMK AO2 PK WND 01037/1907 SHRA DSNT NW MOV E KDFW 111853Z 09006KT 10SM FEW050 SCT200 BKN250 36/21 A2988 RMK AO2 SLP107 T03560206 KDFW 111753Z 14010G15KT 120V200 10SM FEW040 SCT200 BKN300 35/22 A2988 RMK AO2 SLP107 T03500222 10350 20283 50003 DFW outflow case - What happened? End of the 100 streak! This was NOT an easy forecast. Forecast issued at 15z for Dallas area – from “Point and Click” NWS interface This Afternoon: Mostly sunny and hot, with a high near 102. Heat index values as high as 106. South southeast wind around 10 mph. Aviation, Range and Aerospace Meteorology Symposium, AMS Annual Meeting, New Orleans, Louisiana
Below are the TAFs before and during the event with the observations repeated. The routine TAF issued at 1725z, less than 2-h before the outflow passes, had no mention of the wind change. The update at 1853z had an outflow but not strong enough. The wind shift from prevailing SE winds to strong northerly is significant, and likely caused a reconfiguration of the runways. KDFW 111725Z 1118/1224 15012KT P6SM FEW040 SCT180 FM120200 18013KT P6SM SCT150 KDFW 111853Z 1119/1224 36015G25KT P6SM SCT035 BKN050 TEMPO 1119/1120 14012KT FEW040 FM112200 04012KT P6SM SCT050 BKN070 FM120200 18013KT P6SM SCT150 KDFW 111906Z 1119/1224 36015G25KT P6SM VCTS SCT035CB BKN050 TEMPO 1119/1120 09006KT FM112200 04012KT P6SM SCT050 BKN070 FM120200 18013KT P6SM SCT150 Repeat of the wind observationsat DFW: KDFW 111914Z 36026G37KT 10SM SQ PK WND 01037/1907 SHRA DSNT NW MOV E KDFW 111853Z 09006KT KDFW 111753Z 14010G15KT Aviation impact Aviation, Range and Aerospace Meteorology Symposium, AMS Annual Meeting, New Orleans, Louisiana
1200 UTC 1600 UTC Weather overview for 11 August 2011 – METARs and NOWRAD reflectivity. Arrow points to KDFW (labeled H) 1800 UTC 1900 UTC During this period a short and rather straight line shapes up at 16z that then expands southward towards DFW. Closeups are shown later.
2000 UTC 2100 UTC Weather overview for 11 August 2011 – METARs and NOWRAD reflectivity. Arrow points to KDFW (labeled H) 1900Z Obs w/1923z Vis 1800Z Obs w/1825z Vis The overall line quickly dies after passing DFW, although some cells did develop to the west of DFW at 21z, but then diminished after this time.
1900 UTC 2000 UTC Closeup of conditions – METARs and NOWRAD reflectivity with county boundaries. Arrow points to KDFW. 2100 UTC The echoes certainly die out but not until the outflow roars by DFW.
1755 UTC There is a well-defined radar fine line marking the outflow boundary that is ahead of the radar echoes. A strong echo does survive and is just nw of DFW at 19z. DFW (KFWS) radar – reflectivity and velocity images near time of outflow passage. 1858 UTC reflectivity velocity
NAM forecasts from the 1200 UTC run – model surface reflectivity, wind and temperature Analysis at 12z 3-h forecast valid 15z 6-h forecast valid 18z 9-h forecast valid 21z There is no sign of a southward-moving outflow in the NAM forecasts. Forecast temperatures are near 105 for the Dallas area.
GFS 6-h forecast from the 1200 UTC run – model surface wind and temperature with 6-h precipitation ending at 1800 UTC. Some precip west of DFW but no outflow and northerly winds. Aviation, Range and Aerospace Meteorology Symposium, AMS Annual Meeting, New Orleans, Louisiana
NOWRAD observed at 1500 UTC STMAS – analysis at 1500 UTC STMAS run from 1500 UTCComposite Reflectivity STMAS – 1 h forecast valid 1600 UTC The STMAS analysis nicely captures the observed reflectivity. Much of the echo is maintained across OK at 1-h into the forecast, but not the line structure that is observed (arrows). Small white circle marks the location of Dallas. LAPS analysis (closeup) at 1600 UTC)
Note that the temperature scales are the same in the STMAS forecast and the LAPS analysis. A thunderstorm line and outflow does form after a couple of hours into the forecast but it is behind (slower than) the observed outflow, which is approaching DFW (white circle). STMAS run from 1500 UTC3-h forecasts STMAS – 3h composite reflectivity valid 1800 UTC STMAS – 3h Surface Temp and wind valid 1800 UTC LAPS analysis NOWRAD observed
By 6-h into the forecast (the last forecast hour for the STMAS run) an extensive outflow boundary is approaching DFW. Although still about a county behind the observed position, this forecast would have certainly caught the attention of the forecasters. STMAS run from 1500 UTC6-h forecasts STMAS – 6h composite reflectivity valid 2100 UTC STMAS – 6h Surface Temp and wind valid 2100 UTC LAPS analysis NOWRAD observed
STMAS – 0-h composite reflectivity STMAS has a good analysis of the 1800 UTC reflectivity and outflow position. Strong echo is still present at 1900 UTC, but the line is less organized west of DFW (white circle). STMAS run from 1800 UTC NOWRAD observed at 1800 UTC STMAS – 1-h composite reflectivity valid 1900 UTC NOWRAD (observed) at 1900 UTC
DFW is again marked by the white oval. The arrows point to the leading edge of the outflow boundary and line of echoes. The STMAS 2-h forecast maintains a broken line of echoes with a well-defined outflow boundary that compares favorably to the observed position at 2000 UTC, and does pass through DFW. STMAS run from 1800 UTC2-h forecasts valid 2000 UTC STMAS – 2h composite reflectivity valid 2000 UTC STMAS – 2h Surface Temp and wind valid 2000 UTC LAPS analysis of surface temperature and wind at 2000 UTC NOWRAD (observed) at 2000 UTC
NAM forecasts from the 1800 UTC run – model surface reflectivity, wind and temperature Analysis at 1800 UTC 3-h forecast valid 2100 UTC 6-h forecast valid 0000 UTC 3-h precipitation forecast ending 2100 UTC Convection is only partly captured in the analysis and while some develops, there is no outflow near DFW.
GFS 1800 UTC run – model surface wind, temperature and precipitation GFS 0-h valid 1800 UTC GFS6-h accumulated precipitation forecast ending 0000 UTC The GFS does have precipitation near DFW but it is not well correlated with what is observed, and there is no evidence of outflow in the GFS surface winds. 6-h estimated precipitation ending 0000 UTC
Case 2: Severe Thunderstorms across the Ohio Valley on 14 Nov 2011 • A thin line of strong storms along the cold front and a general area of thunderstorms • 2 tornadoes reported with each of these areas (4 total) • Plus a lot of severe weather reports • Runs initialized at 1800 UTC are compared • STMAS hot start • LAPS hot start • STMAS cold start Aviation, Range and Aerospace Meteorology Symposium, AMS Annual Meeting, New Orleans, Louisiana
Radar Overview: strong line of severe storms forms along a cold front moving through the Ohio Valley. 1900 UTC 1800 UTC 2000 UTC Aviation, Range and Aerospace Meteorology Symposium, AMS Annual Meeting, New Orleans, Louisiana
LAPS Forecast – 0 h STMAS “Cold Start” Forecast – 0 h Initial Composite Reflectivity from 1800 UTC runs LAPS Analysis STMAS Forecast – 0 h
LAPS Forecast STMAS “Cold Start” Forecast 15-minute forecast valid 1815 UTC of Composite Reflectivity LAPS Analysis STMAS Forecast There is no problem hanging onto echo in the STMAS and LAPS forecasts, with a clear advantage over the cold start run.
LAPS Forecast STMAS “Cold Start” Forecast 30-minute forecast valid 1830 UTC of Composite Reflectivity LAPS Analysis STMAS Forecast The most challenging part of the forecast is the thin line of echo along the cold front (oval).
LAPS Forecast STMAS “Cold Start” Forecast 60-minute forecast valid 1900 UTC of Composite Reflectivity LAPS Analysis STMAS Forecast STMAS has the best forecast with a broken line of strong cells along the cold front (oval). Nothing yet there in the cold start.
LAPS Forecast STMAS “Cold Start” Forecast 2-hour forecast valid 2000 UTC of Composite Reflectivity LAPS Analysis STMAS Forecast By 2-h into the forecast all 3 runs have echoes along the cold front.
Summary • Progress has been made in transitioning LAPS into the more sophisticated STMAS • The result should be a better analysis that has nowcasting and other applications • Model launched from STMAS analysis • Hot start allows the model to retain initial echoes • Advantage can persist for up to ~2-h into the forecast Aviation, Range and Aerospace Meteorology Symposium, AMS Annual Meeting, New Orleans, Louisiana