Download
1 / 1
10 likes | 123 Vues
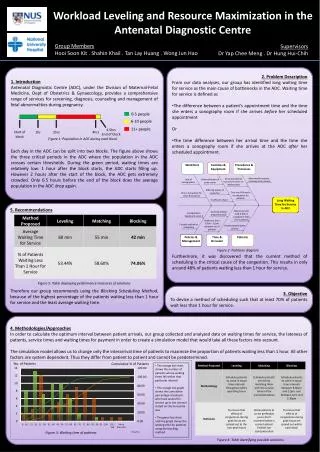
Workforce. Facilities & Equipment. Procedures & Processes. Abnormality requires scanning to be redone. Some procedures can only be done on Wednesdays. Lack of Sonographers. Underutilization of some rooms. Differing quality of resolution. Only one PSA works on payments for patients.

E N D
Workforce Facilities & Equipment Procedures & Processes Abnormality requires scanning to be redone Some procedures can only be done on Wednesdays Lack of Sonographers Underutilization of some rooms Differing quality of resolution Only one PSA works on payments for patients Only 1 Consultant for some Procedures Long Waiting Time for Service in ADC Insufficient chairs Patient sent for walk if ADC is crowded or fetus not in position Scanning follows pregnancy cycle Sonographers headcount set at 4 Peak hour from 10am – 12pm increases no. of patients Current method of scheduling Private patients given priority Policies & Management Time & Occasion Patients Workload Leveling and Resource Maximization in the Antenatal Diagnostic Centre 4hrs 4.5hrs End of block Start of block 2hrs 1hr 0-5 people 6-10 people 11+ people Group Members Hooi Soon Kit . Shahin Khail . Tan Lay Huang . Wong Jun Hao Supervisors Dr Yap Chee Meng . Dr Hung Hui-Chih 4. Methodologies/Approaches In order to calculate the optimum interval between patient arrivals, our group collected and analyzed data on waiting times for service, the lateness of patients, service times and waiting times for payment in order to create a simulation model that would take all these factors into account. The simulation model allows us to change only the interarrival time of patients to maximize the proportion of patients waiting less than 1 hour. All other factors are system dependent. Thus they differ from patient to patient and cannot be predetermined. 1. Introduction Antenatal Diagnostic Centre (ADC), under the Division of Maternal-Fetal Medicine, Dept of Obstetrics & Gynaecology, provides a comprehensive range of services for screening, diagnosis, counseling and management of fetal abnormalities during pregnancy. Each day in the ADC can be split into two blocks. The figure above shows the three critical periods in the ADC where the population in the ADC crosses certain thresholds. During the green period, waiting times are relatively low. 1 hour after the block starts, the ADC starts filling up. However 2 hours after the start of the block, the ADC gets extremely crowded. Only 0.5 hours before the end of the block does the average population in the ADC drop again. • 2. Problem Description • From our data analyses, our group has identified long waiting time for service as the main cause of bottlenecks in the ADC. Waiting time for service is defined as • The difference between a patient’s appointment time and the time she enters a sonography room if she arrives before her scheduled appointment • Or • The time difference between her arrival time and the time she enters a sonography room if she arrives at the ADC after her scheduled appointment. • Furthermore, it was discovered that the current method of scheduling is the critical cause of the congestion. This results in only around 48% of patients waiting less than 1 hour for service. Cumulative % of Patients Figure 1: Population in ADC during each block 5. Recommendations Therefore our group recommends using the Blocking Scheduling Method, because of the highest percentage of the patients waiting less than 1 hour for service and the least average waiting time. Figure 2: Fishbone diagram Figure 5: Table displaying performance measures of solutions 3. Objective To devise a method of scheduling such that at least 70% of patients wait less than 1 hour for service. No. of Patients • The orange bar chart shows the number of patients whose waiting times fall within that particular interval • The orange line graph shows the cumulative percentage of patients who have waited for service up to the interval stated on the horizontal axis • The green bar chart and line graph shows the waiting time for patients using the blocking method Figure 3: Waiting time of patients Time/min Fig 3: Waiting Time for Service Figure 4: Table identifying possible solutions