Download
1 / 10
100 likes | 262 Vues
The Effect of Visual and Auditory Distracters on Perceptual Load. Bronson Maschmeyer and Mark Donald 201202793 and 201101136 Presented to Dr. Austen for PSYC 225 April 1 st , 2014. Do visual or auditory distracters have more of an effect on perceptual load?.

E N D
The Effect of Visual and Auditory Distracters on Perceptual Load Bronson Maschmeyer and Mark Donald201202793 and 201101136Presented to Dr. Austen for PSYC 225April 1st, 2014
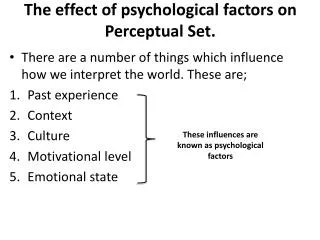
Do visual or auditory distracters have more of an effect on perceptual load? • Perceptual load is a theory that states that the brain has a finite capacity to process information. When incoming sensory stimuli take up some of that capacity, the amount of processing power left for another task is reduced. VS
Experimental Design Do visual or auditory distracters have more of an effect on perceptual load? • Auditory and Visual distracter testing groups • Both participate first in control test • Results of control and variable tests are recorded and analyzed
Variables • Independent Variable- Distracter Type (2 Levels, visual and Auditory) • Dependent Variable- Perception of touch stimuli, represented by number of correct responses to tests
Hypothesis • We hypothesized that the auditory distracter would have the largest effect on the number of correct responses
Analysis • Done via IBM SPSS Statistics, v15.0 • Two-way, within-between, repeated measures ANOVA • Level of significance was set at 0.05 • Statistics always tests the null hypothesis. If the significance is less than 0.05, the results are statistically significant. • Large F value indicates large difference between means
Conclusion • We reject our hypothesis, as the data did not support it • The expected drop in correct responses for the auditory distracter group was not seen, there was an increase • We are not sure of the reason for the increase that was seen • The visual distracter state resulted in a drop in correct responses, as expected.
Limitations and Future Research Limitations: • Small sample size • Ideal distracters? • Methodology change • Consistency of touch • Future Research • Address the limitations of this study • Does the effect change depending on which hand is used? • Does the volume of the auditory distracter matter?