Climate Change Action Fund (CCAF) Call for proposals on “Climate Change; Variability and Extremes” A first evaluation of
120 likes | 1.03k Vues
Climate Change Action Fund (CCAF) Call for proposals on “Climate Change; Variability and Extremes” A first evaluation of the strength and weaknesses of statistical downscaling methods for simulating extremes over various regions of eastern Canada Georges-É. Desrochers, Hydro-Québec

Climate Change Action Fund (CCAF) Call for proposals on “Climate Change; Variability and Extremes” A first evaluation of
E N D
Presentation Transcript
Climate Change Action Fund (CCAF) Call for proposals on “Climate Change; Variability and Extremes” A first evaluation of the strength and weaknesses of statistical downscaling methods for simulating extremes over various regions of eastern Canada Georges-É. Desrochers, Hydro-Québec Elaine Barrow & Philippe Gachon, CCIS Victoria Slonosky, Ouranos Taha Ouarda, INRS-ETE Tan-Danh Nguyen, McGill Diane Chaumont, Ouranos Marie-Claude Simard, Ouranos Massoud Hessami, INRS-ETE Mohammed Abul Kashem,INRS-ETE Alain Bourque, Ouranos René Roy, Hydro-Québec Guenther Pacher, Hydro-Québec Charles Lin, McGill Van TV Nguyen, McGill André St-Hilaire, INRS-ETE Bernard Bobée, INRS-ETE Jennifer Milton, Environment Canada Jeanna Goldstein, Environment Canada
Datasets Calibration Validation Tests to evaluate model performance (explained variance, RMSE, RRMSE, skill scores, extremes indexes) Method to simulate climate scenarios: Use of the Empirical Statistical Downscaling Models Datasets: raw, standardized by means and standard deviation (NCEP, GCMs) Validation methods: simple, cross, bootstrap Treatment of «unexplained» part of variance: inflation, randomization
SDSM - regression based downscaling model with stochastic weather generator LARS-WG - stochastic weather generator seasonal definitions the choice of transformation functions ( fourth root, natural log, inverse normal ) the value of the conditional model parameters ( variance inflation, bias correction ) the chosen period of time and its length the local knowledge to define combination of predictors Empirical Statistical Downscaling(is based on empirical relationships between local-scale predictands and regional-scale predictors; circulation types; extreme value analysis etc. ) SENSITIVITY TO:
Calibration step: SDSM structure. Different variantsof the transfer function variables (multiple regressions, linear and non-linear, combined with stochastic weather generator) Seasonal definition: Monthly (*) Calibration period: 1961-1975 Threshold for Precipitation: 1mm/day (*) predictor variables shall be accurately simulated by GCMs (normalisation reduces systematic biases in the mean and variance of GCMs predictors)
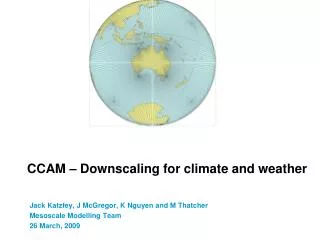
Quebec (Canada) Regions of Statistical Downscaling Robustness Study 1 2 4 3 6 5
Candidate predictor variables to form optimum predictor set (Fourth root is chosen as transformation function) Free atmosphere parameters, large-scale surface circulation parameters, moisture are recommended for statistical downscaling (Beckmann and Buishand, 2002; Hewitson, 2001; Huth, 1999; Huth et al., 2001; Huth, 2002; Trigo and Palutikof, 1999; Wilby et al., 2001; Wilby and Wigley, 2000).
Inflation parameter adjustmentfor SDSM precipitation simulation Montreal-Dorval region 1976-1990 Autumn %tile-%tile plot of SDSM –WG downscaled precipitation vs observations Simple Validation step Inflation parameter = 3 Bias correlation parameter = 0.85 25 till 90%tile Average Inflation parameter = 12 Bias correlation parameter = 0.85 25 5
Uncertainty associated with the use of GCM data Simple Validation step till 90 %-tile Autumn %tile-%tile plots for Montreal-Dorval region 1976-1990 of simulated precipitation vs observations SDSM-Generator: CGCM1 data CGCM1 GHG+A1 SDSM-WG: NCEP data Estimation statistic SDSM WG/Gen GCM inf. 3 inf. 7 inf. 9 inf. 12 inf. 15 bias -3.6-1.0/-1.3 -0.8/-1.2 -0.8/-1.1 -0.6/-1.0 -0.52/-0.8 RMSE 8.7 6.8/7.8 7.1/8.0 7.2 /8.2 7.5/8.4 7.7/8 RMSE %til. 4.9 6.4 / 5.5 5.0/4.3 4.3/3.5 3.1/2.8 2 .2/1.2
Simple Validation step: test of the accuracy of the winter/summer maximum temperature simulated series for 1976-1990.Estimation of uncertainty associated with the use of GCMs Winter / Summer SDSM-WG SDSM-GEN CGCM1 GHG+A1 Bias (deg C) Montreal-Dorval -0.5 / 1.1 3.8 / -0.6 3.5 / -1.9Kuujjuarapic -0.6 / 0.3 4.8 / -4.3 8.2 / 2.1Moosonee -0.5 / 1.0 5.5 / -3.1 7.3 / 0.3Percentiles Bias (deg C) Montreal-Dorval -0.5 / 1.1 3.8 / -0.6 3.4 / -1.9Kuujjuarapic -0.6 / 0.3 4.8 / -4.3 8.2 / 2.0Moosonee -0.3 / 1.0 5.5 / -3.1 7.2 / 0.3 Winter / Summer SDSM-WG SDSM-GEN CGCM1 GHG+A1 RMSE (deg C) Montreal-Dorval 2.9 / 2.4 9.8 / 5.9 8.0 / 4.9Kuujjuarapic 3.7 / 4.5 10.6 / 9.9 11.8 / 7.4Moosonee 3.5 / 3.7 11.4 / 8.4 11.3 / 6.3Percentiles RMSE (deg C) Montreal-Dorval 0.8 / 1.2 3.9 / 1.3 6.1 / 2.1Kuujjuarapic 0.8 / 1.4 5.1 / 4.4 8.8 / 4.1Moosonee 0.4 / 1.3 5.8 / 3.2 8.4 / 2.6 Spring %tile-%tile plot of SDS models and GCM Tmax vs observations for Montreal region 1976-1990
Relevant indices to the field of user demand (derived from downscaled series and compared with observed) Software STARDEX ( STatistical and Regional dynamical Downscaling of Extremes for European regions) Diagnostic Extremes Indices graph: • Agronomical relevant indices for • Spain (Winkler et al., 1997): • the Julian date of first and last frost • the first occurance of Tmax > 25 deg C • the frequency of days with Tmax > 35deg C • Water resources relevant indices • (Goldstein and Milton, 2003): • Max number of consecutive dry days • Max number of consecutive wet days • 90th percent. of rainday amounts • Greatest 5-day total rainfall • 90th Tmax percent http://www.cru.uea.ac.uk/cru/projects/stardex/
Results, Recommendations and Conclusions: • The step of the SDSM validation shall be executed with the different set of predictors and settings parameters with verification by seasons or months • SDSM-WG simulates adequately Tmax for all seasons. • Local climate (Tmax simulation) is represented with higher accuracy for winter by SDSM-GEN than by CGCM1 GHG+A1 for the north of Quebec • Estimation statistic reports less discrepancy values between Tmax downscaled simulated data (SDSM-GEN) and observations in the north region for autumn • Precipitation are simulated less accurately for summer and autumn • SDS models shall use output of the different GCMs which forced by different type of the greenhouse gases values to treat uncertainties • SDSM simulated scenarios shall be treated individually. It is not plausible to average simulated scenarios daily • STARDEX software shall be used to define extremes indices - a measure of similarity between observed and simulated time series • The first version of the Ouranos SDSM validation tool is created
Future Plans • Definition of the transfer functions variants for different Quebec regions and analysis of their similarity • Use of a stepwise multiple linear regression technique • Use of the CGCM2 - SRES «A2», «B2» output • Further verification of the ability of the Statistical DownScaling models to catch extremes events • Use of STARDEX software to define extremes indices Thank you to CCAF