Download
1 / 48
480 likes | 483 Vues
This article discusses the growing obesity epidemic among both U.S. adults and children, highlighting the trends, causes, and impacts of this health issue. It explores the increasing prevalence of obesity, the associated health problems, and the negative effects on academic achievement. Furthermore, it emphasizes the need for proactive measures to address and prevent obesity among individuals of all age groups.

E N D
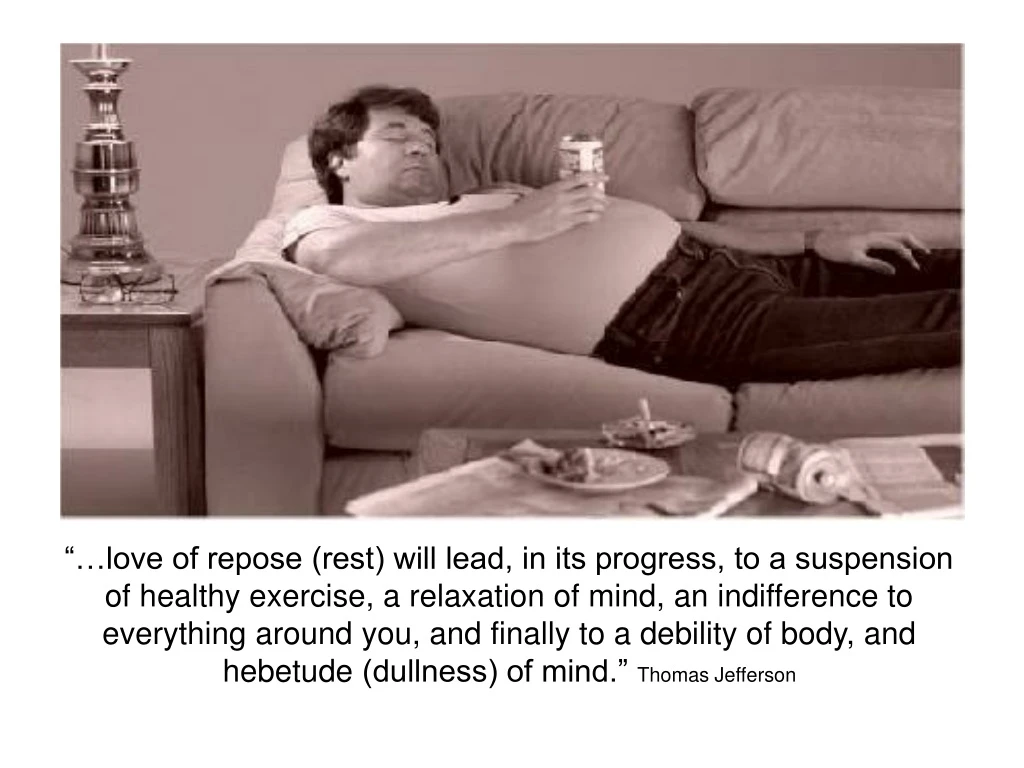
“…love of repose (rest) will lead, in its progress, to a suspension of healthy exercise, a relaxation of mind, an indifference to everything around you, and finally to a debility of body, and hebetude (dullness) of mind.” Thomas Jefferson
The Evolution of an Epidemic Obesity Trends* Among U.S. AdultsBRFSS, 1985 (CDC) No Data <10% 10%–14%
The Evolution of an Epidemic Obesity Trends* Among U.S. AdultsBRFSS, 1986 No Data <10% 10%–14%
The Evolution of an Epidemic Obesity Trends* Among U.S. AdultsBRFSS, 1987 No Data <10% 10%–14%
The Evolution of an EpidemicObesity Trends* Among U.S. AdultsBRFSS, 1988 No Data <10% 10%–14%
The Evolution of an EpidemicObesity Trends* Among U.S. AdultsBRFSS, 1989 No Data <10% 10%–14%
The Evolution of an Epidemic Obesity Trends* Among U.S. AdultsBRFSS, 1990 No Data <10% 10%–14%
The Evolution of an Epidemic Obesity Trends* Among U.S. AdultsBRFSS, 1991 No Data <10% 10%–14% 15%–19%
The Evolution of an Epidemic Obesity Trends* Among U.S. AdultsBRFSS, 1992 No Data <10% 10%–14% 15%–19%
The Evolution of an Epidemic Obesity Trends* Among U.S. AdultsBRFSS, 1993 No Data <10% 10%–14% 15%–19%
The Evolution of an Epidemic Obesity Trends* Among U.S. AdultsBRFSS, 1994 No Data <10% 10%–14% 15%–19%
The Evolution of an Epidemic Obesity Trends* Among U.S. AdultsBRFSS, 1995 No Data <10% 10%–14% 15%–19%
The Evolution of an Epidemic Obesity Trends* Among U.S. AdultsBRFSS, 1996 No Data <10% 10%–14% 15%–19%
The Evolution of an Epidemic Obesity Trends* Among U.S. AdultsBRFSS, 1997 No Data <10% 10%–14% 15%–19% ≥20%
The Evolution of an Epidemic Obesity Trends* Among U.S. AdultsBRFSS, 1998 No Data <10% 10%–14% 15%–19% ≥20%
The Evolution of an Epidemic Obesity Trends* Among U.S. AdultsBRFSS, 1999 No Data <10% 10%–14% 15%–19% ≥20%
The Evolution of an Epidemic Obesity Trends* Among U.S. AdultsBRFSS, 2000 No Data <10% 10%–14% 15%–19% ≥20%
The Evolution of an Epidemic Obesity Trends* Among U.S. AdultsBRFSS, 2001 No Data <10% 10%–14% 15%–19% 20%–24% ≥25%
The Evolution of an Epidemic Obesity Trends* Among U.S. AdultsBRFSS, 2002 No Data <10% 10%–14% 15%–19% 20%–24% ≥25%
The Evolution of an Epidemic Obesity Trends* Among U.S. AdultsBRFSS, 2003 No Data <10% 10%–14% 15%–19% 20%–24% ≥25%
The Evolution of an Epidemic Obesity Trends* Among U.S. AdultsBRFSS, 2004 No Data <10% 10%–14% 15%–19% 20%–24% ≥25%
The Evolution of an Epidemic Obesity Trends* Among U.S. AdultsBRFSS, 2005 No Data <10% 10%–14% 15%–19% 20%–24% 25%–29% ≥30%
The Evolution of an Epidemic Obesity Trends* Among U.S. AdultsBRFSS, 2006 No Data <10% 10%–14% 15%–19% 20%–24% 25%–29% ≥30%
The Evolution of an Epidemic Obesity Trends* Among U.S. AdultsBRFSS, 2007 No Data <10% 10%–14% 15%–19% 20%–24% 25%–29% ≥30%
The Evolution of an Epidemic Obesity Trends* Among U.S. AdultsBRFSS, 2008 No Data <10% 10%–14% 15%–19% 20%–24% 25%–29% ≥30%
The Evolution of an Epidemic Obesity Trends* Among U.S. AdultsBRFSS, 2009 No Data <10% 10%–14% 15%–19% 20%–24% 25%–29% ≥30%
The Evolution of an Epidemic Obesity Trends* Among U.S. AdultsBRFSS, 2010 No Data <10% 10%–14% 15%–19% 20%–24% 25%–29% ≥30%
Childhood health problems, caused by inactivity, are a growing • problem in the United States . Obesity among children: • More than doubled for children 2-5 years of age • More than doubled for adolescents 12-19 years of age • More than tripled for children 6-11 years of age. • -Obesity appears to lessen life expectancy markedly, especially • among younger adults. [Journal of the American Medical Association (JAMA) Jan 8, 2003] • 62% of elementary children have at least one CHD/CAD risk factor and 21% • had three or more ] • 27% of overweight 1-5 yr olds, • 43% of overweight 3-9 yr olds, • 86% of overweight 10-13 year olds become overweight adults • [American Journal of Public Health]. • -By age 11 obesity is considered persistentDr. J Wardle - University College London • Study tracked nearly 6,000 children in Britain over five years • -$14 billion spent annually on child obesity-related health care costs • -Today’s American children may be the first generation to live shorter lives than their parents
The Problems Obesity and Overweight Causes for Learners Attendance -Overweight MS students had 25% more absences and 39% more days tardy to school relative to overweight students. Shore, et al.. “Decreased Scholastic Achievement in Overweight Middle School Students.” Obesity. 16 (2008): 1535-1538. -Obesity associated with higher absenteeism in elementary students. Geier et al Obesity (2007) 15, 2157–2161; Study of 1069 Philadelphia inner city 4th – 6th graders Academic Achievement -BMI inversely related to academic achievement -Hillman & Castelli @ University of Illinois (2007) Journal of Sport & Exercise Psychology, 2007, 29, 239-252 Study of 259 3rd & 5th graders found higher BMI associated with lower standardized test scores -Byrd et al (2007) The Impact of Physical Activity and Obesity on Academic Achievement Among Elementary Students BMI of students affected the students’ performance in both reading and mathematics achievement. -Faulkner et al (2001) 22% of obese boys and 16% of obese girls report being held back or repeating a grade Behavior -BMI inversely related to behavioral incidents -Overweight kids are three times more likely more likely to have behavior problems (2003) Lumeng et al. U of Michigan study or 755 8-11 yr olds as part of the National Longitudinal Survey of Youth using the Behavior Problems Index -Overweight and Obese students are more likely to be the target of bullying (2003) Ian Janssen, PhD
Toddler Obesity Lowers IQ 4 yr olds with early onset obesity have a 28 point lower IQ than their normal weight siblings
Quality PE Provides REDUCES Obesity • Participation in PE and other physical activity reduces the chances that adolescents will be overweight as young adults. • “Each weekday that adolescents participated in physical education decreased the odds of being an overweight adult by 5%, with participation in all 5 weekdays of physical education decreasing the odds by 28%.” Source: Menschik, D., et. al. “Adolescent Physical Activities as Predictors of Young Adult Weight.” Arch PediatrAdolesc Med. 2008;162(1):29-33. http://archpedi.ama-assn.org/cgi/content/full/162/1/29?maxtoshow=&HITS=10&hits=10&RESULTFORMAT=&fulltext=menschik&searchid=1&FIRSTINDEX=0&resourcetype=HWCIT
Physical Education Reduces the Risk of Overweight and Obesity • Participation in PE reduces the chances that adolescents will become overweight adults. • “Each weekday that adolescents participated in physical education decreased the odds of being an overweight adult by 5%, with participation in all 5 weekdays of physical education decreasing the odds by 28%.” Source: Menschik, D., et. al. “Adolescent Physical Activities as Predictors of Young Adult Weight.” Arch PediatrAdolesc Med. 2008;162(1):29-33. http://archpedi.ama-assn.org/cgi/content/full/162/1/29?maxtoshow=&HITS=10&hits=10&RESULTFORMAT=&fulltext=menschik&searchid=1&FIRSTINDEX=0&resourcetype=HWCIT
Physical education key to improving health in low-income adolescents Kristine A. Madsen, MD, MPH (2009) Released jointly by UCSF and UC Berkeley Archives of Pediatrics & Adolescent Medicine” Nov 2009 Findings • Regular participation in PE class is significantly associated with greater cardiovascular fitness and lower body mass index. “We took an incredibly comprehensive look at all of the opportunities kids have throughout their day to engage in physical activity and determined which are the most strongly linked to fitness and weight status.” “PE was by far the most significant predictor of students’ fitness and was the only variable associated with improved weight status.” Engaging in at least 20 minutes of exercise during PE class was significantly associated with both shorter mile times and lower body mass index scores. Furthermore, as the students’ reported levels of enjoyment of PE increased, their mile times decreased.
Lifestyle of Our Kids (LOOK) Study Professor Dick Telford Australian National University Medical School American Journal Public Health Sept 2011 PE Class a Smart Move Study: 850 8 yr old Australian schoolchildren were followed over a four year period. The study compared children who participated in traditional daily sport activities with those who received specialist education in general fitness skills such as coordination, balance and strength Results: Reduction of Body Fat in the PE Group The study found that pupils in the physical education classes lost an average of 0.25kg of body fat over two years (considered significant for 8- to 10-year-olds) Increase in Standardized Test Scores in PE Group Improved their NAPLAN scores by 10 points more than those who participated in sports only
NYC Vital Signs • A Special Report from the New York City Health Department and the New York City Department of Education – June 2009 Volume 8, No. 1 • Childhood Obesity is a Serious Concern in New York City • Higher Levels of Fitness Associated with Better Academic Performance • STUDY: • The New York City DOHMH and DOE reviewed academic and fitness records of the 600,000 • public school students in grades K-8 who participated in the NYC FITNESSGRAM program during • the 2007-2008 school year. • FINDINGS: • 21% obese and 18% overweight (national average: 17% and 14%) • Obese and overweight students are less physically fit: • Healthy weight students score in the 56 percentile for fitness • Overweight students score in the 49th percentile • Obese students score in the 40th percentile • Academic test scores increased with higher NYC FITNESSGRAM scores across all racial • and ethnic groups • Students’ academic test scores increase with physical fitness scores across all weight categories
Cardiovascular Fitness positively associated with • Intelligence • Swedish Military Study • Cardiovascular fitness is associated with cognition in young adulthood • Aberg, Maria, A. I., et al. PNAS(Proceedings of the National Academy of Sciences) December 8, 2009 • vol. 106 no. 49 20906-20911Edited by Fred H. Gage, The Salk Institute for Biological Studies, San Diego, CA, and approved October 16, 2009 • STUDY: Compared the relationships between cardiovascular fitness and intelligence. Cohort study of all Swedish men born in 1950 through 1976 who were enlisted for military service at age 18 • (N = 1,221,727). Of these, 268,496 were full-sibling pairs, 3,147 twin pairs, and 1,432 monozygotic twin pairs. Grades, test scores, and information on physical fitness were analyzed at age 15 and 18 on all subjects. RESULTS • 1 - Cardiovascular fitness positively associated with intelligence • 2 - Cardiovascular fitness changes between age 15yrs and 18 yrs • predicted cognitive performance at 18 yrs • Those with increased fitness between 15 and 18 y of age exhibited significantly higher global • intelligence scores than those with decreased fitness. Similar results were obtained for • logical, verbal, visuospatial, and technical scores. • 3 - Cardiovascular fitness at age 18 yrs predicted higher socioeconomic • status and educational attainment later in life.
Cardiovascular Fitness Declines Dramatically during the School Years “Fitness levels declined with each passing grade level, corresponding with decreasing emphasis on physical education in upper grades.” Texas Youth Fitness Study Findings Positive correlation between physical activity and 7 categories of cognitive performance – Sibley (2003) -perceptual skills, IQ, achievement, verbal test scores, math test scores, developmental level, academic readiness Pediatric Exercise Science Exercise improves the rate of learning – Cotman -rate of learning directly correlated to BDNF levels (BDNF produced by exercise) Exercise increases executive function – Exercise creates a better response to errors – Hillman - “Flanker Test” results show a positive response to errors made Exercise makes the body more adept in responding to mental challenges - Dienstbier 1989 Exercise reduces stress – elevates mood “Exercise is like a little Ritalin and a little Prozac.” Dr. John RateyHarvard Medical school Complex movement increases executive function
Fitness: the Key to Academic Achievement “Give about two of them [hours] every day to exercise; for health must not be sacrificed to learning. A strong body makes the mind strong.” Thomas Jefferson California Dept. of Education Study (2001) Direct Correlation between level of Fitness and SAT scores STUDY: Approximately one million California school children had their Stanford Achievement Test (SAT) scores compared with their Fitnessgram fitness scores which are comprised of 6 components. RESULTS: With each fitness test passed the level of academic achievement also improved. Delaine EastinSuperintendent of Public Instruction California Department of Education (CDE) • SACRAMENTO, CA "This statewide study provides compelling evidence that the physical well-being of students has a direct impact on their ability to achieve academically," said Eastin. "We now have the proof we’ve been looking for: students achieve best when they are physically fit. Thousands of years ago, the Greeks understood the importance of improving spirit, mind, and body. The research presented here validates their philosophic approach with scientific validation.”
California Department of Education Higher academic achievement is associated with higher levels of fitness in grade 5,7,9. The relationship between academic achievement and fitness in grade 5,7,9 was greater in mathematics than in reading, particularly at high fitness levels.
Texas Youth Fitness Study • A Texas study shows similar positive results. The study of 2.4 million Texas students in grades 3-12 during the 2007-2008 academic year compared level of physical fitness to academic and related indicators. “Significant associations were consistently found between physical fitness and various indicators of academic achievement, specifically: • Academic Performance (TAKS) – Higher levels of fitness are associated with better academic performance. • School Attendance – Higher levels of fitness are associated with better school attendance. • School Incidents– Higher levels of fitness are associated with fewer negative school incidents [including incidents involving drugs, alcohol, violence and truancy].” Source: Cooper Institute and the Texas Education Agency. March 2009. http://www.cooperinstitute.org/ourkidshealth/
Adding PE Increases Cardiovascular Fitness Study: Conrad Fischer Elementary School (Elmhurst, Ill) involving 5 sections of 3rd graders: Control Group – 3 sections received PE 2 days per week Experimental Group – 2 sections received 5 days per week Results: The daily PE group showed better than double the cardiovascular improvement and significant gains in Reading and Math over the limited PE group.
Daily Physical Education and Physical Activity Changes Fitness, Academics, and Behavior Anthony Elementary in Leavenworth, Kansas Edutopia (Dec/Jan 2006) In 2004 Anthony increased PE and PA from one to five days a week, revamped their school lunch program, and added vitamins to the daily menu. Anthony had three remarkable changes in one year: There was a 1300+% increase in those passing the fitness test. They went from 10th in Reading and 9th in Math (in a district with 10 elementary schools) to 2nd in Reading and 1st in Math. 3. Office referrals for discipline were reduced from 438 to 18.
Daily Physical Education Transforms Schools Naperville Central High school (Ill.) Daily PE for all students 9th grade 3% overweight /obese vs (Ntl Ave: 32%) Graded on time in target heart rate zone TIMMSS Test (Trends in International Mathematics and Science Study) Results: Asian countries have nearly 50% of their students score in the top tier / US students – 7% Naperville Central’s results: Science: #1 in the world Math: #6 in the world Titusville Schools(Pennsylvania) SPARK p32 1999-2000: Reading: Below state average on standardized tests Math: Below state average 2000-01: Lengthened school day Reduced academic time to make room for daily PE 2000-2001 RESULTS: Reading 17% above state average Math 18% above state average No middle school fights since the program began
Average composite of 20 students brains taking the same test Exercise Makes the Brain Learning Ready Brain after sitting quietly Brain after 20 minute walk Research/scan compliments of Dr. Chuck Hillman University of Illinois
Learning Readiness THE EFFECT OF ACUTE TREADMILL WALKING ON COGNITIVE CONTROL AND ACADEMIC ACHIEVEMENT IN PREADOLESCENT CHILDREN Hillman et al 2009 Study: 20 normal functioning preadolescent children were tested after a 20 minute bout of moderate (60% maxHR) treadmill walking and after a 20 minute sedentary period on brain activity (event-related brain potential – ERP) and applied aspects of cognition (response accuracy and academic achievement). Results: Participants scored a full grade level higher in reading comprehension after PA than after a period of rest. PA increased response accuracy and ERP levels. “As demonstrated from previous literature, this study indicated that, after a 20 minute bout of PA, children scored higher on multiple assessments of cognition and academic performance as compared to a 20 minute rest period. Specifically, children performed significantly better in reading comprehension, with participating children scoring approximately a full grade level higher in reading comprehension after PA than after a period of rest.”
Recommendations vs. Reality • NASPE & CDC Recommendations for PE • Elementary School: 150 minutes per week • Middle school & High School: 225 minutes per week • Reality • A recent CDC report found daily PE in only: • 4% of elementary schools • 8% of middle schools • 2% percent of high schools • Physical activity in children is declining • Fewer than 1 in 4 children get 20 minutes of vigorous physical activity per week • Over one-third of adolescents aged 12 to 17 are physically active less than 3 out • of 7 days a week. • Nearly 10% of students in grades 9-12 participate in no vigorous or moderate • physical activity on a weekly basis. “Cutting off physical exercise – the very activity most likely to promote cognitive performance – to do better on a test score is like trying to gain weight by starving yourself.” Dr. John Medina: Developmental molecular biologist / professor of bioengineering @ the University of Washington School of Medicine / Director of the Brain Center for Applied Learning Research @ Seattle Pacific University