Advanced Velocity and Pressure Analysis for Oceanographic Data Quality Assessment
This document outlines a comprehensive methodology for analyzing velocities and pressure data in oceanographic studies. It focuses on signal strength checks, bad velocity checks, and conversion to Earth coordinates. The procedure includes computing spectra, identifying good bins based on frequency ranges, and performing spike tests. Additionally, it highlights the importance of passing various flags to ensure data integrity. Parameters like dominant wave direction, wave height, and wave period are also analyzed to assess the oceanographic conditions accurately.

Advanced Velocity and Pressure Analysis for Oceanographic Data Quality Assessment
E N D
Presentation Transcript
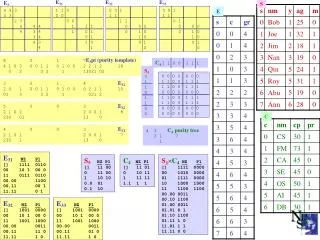
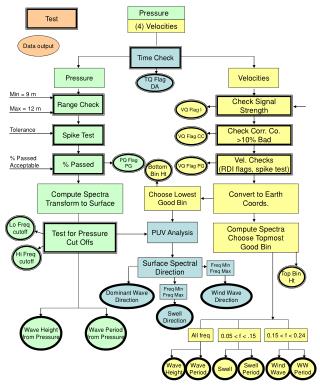
Velocities Check Signal Strength Check Corr. Co. >10% Bad Vel. Checks (RDI flags, spike test) Convert to Earth Coords. Compute Spectra Choose Topmost Good Bin All freq 0.05 < f < .15 0.15 < f < 0.24 Pressure Test (4) Velocities Data output Time Check Pressure TQ Flag DA Min = 9 m Max = 12 m Tolerance % Passed Acceptable Range Check VQ Flag I Spike Test VQ Flag CC PQ Flag PG % Passed VQ Flag PG Bottom Bin Ht Compute Spectra Transform to Surface Choose Lowest Good Bin Lo Freq cutoff PUV Analysis Test for Pressure Cut Offs Hi Freq cutoff Surface Spectral Direction Freq Min Freq Max Top Bin Ht Dominant Wave Direction Freq Min Freq Max Wind Wave Direction Swell Direction Wave Height from Pressure Wave Period from Pressure Wave Height Wave Period Swell Swell Period WindWave WWPeriod