Download
1 / 21
210 likes | 388 Vues
Orchestrating Success with Universal Screeners. Fall 2012 -Spring 2013. How it all began…. Summer 2012 : Chichester School District was contacted by PaTTAN to participate in a study to test the sensitivity of 2 universal behavior screeners at the secondary level.

E N D
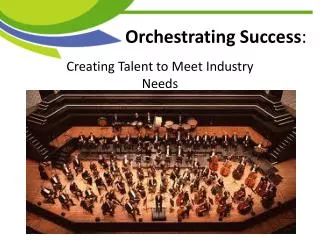
Orchestrating Success with Universal Screeners Fall 2012 -Spring 2013
How it all began… Summer 2012: Chichester School District was contacted by PaTTAN to participate in a study to test the sensitivity of 2 universal behavior screeners at the secondary level. Fall 2012: Chichester Middle & High School prepared the data needed for the researchers, Wendy Oakes (Arizona State University) and Kathleen Lane (University of Kansas) on their visit, October 2, 2012.
Data was provided to this project from District database in reports that listed by Student Name, Teacher Name, Class/Subject and Student ID. School used the Student Names for calculations. Researchers used the Student ID for calculations.
Process / Procedures: • Every teacher of 8th period (high school) and 2nd period (middle school) completed 2 separate screeners to identify students at no risk, moderate risk and significant risk. • Both screeners were done on paper Fall 2012 by teachers in an extended after-school staff meeting, coordinated by Wendy Oakes and Kathleen Lane and supported by PaTTAN: Tina Lawson, Donna Salkin and Diane Funsten. • SSIS: Social Skills Improvement System (Pearson) • SSRS: Social Skills Rating System
The SSIS Performance Screening Guide focuses on observable behaviors in four skill areas: • ProsocialBehaviors • Motivation to Learn • Reading Skills • Math Skills Educators identify the level of performance for the student using criterion-referenced performance continua for each of these areas to measure the student’s skills against grade-level expectations.
The Social Skills Rating System allows you to obtain a more complete picture of social behaviors from teachers. • Teachers evaluate a broad range of socially validated behaviors-behaviors that affect teacher-student relationships, peer acceptance, academic performance, and more.
Then the real work began… • A support team was then assembled to determine how best to help match students who scored significant and moderate risk on one or more screeners with appropriate interventions. • This support team was different than SAP. It became the group that maintained all referrals to SAP as well as interventions that were Tier 2.
Chichester High School Student Management Team Meghan Castagna, guidance counselor Joan Irwin, Social Worker and SAP coordinator Dan Chominski, guidance counselor Nancy Alexander, Administrator Nicole Athey, Internal Tier 2/3 coach and guidance counselor Allison Ricco, school psychologist Joelle Bobel, guidance counselor
Chichester Middle School Student Management Team AneidaMerriweather, guidance counselor Steve Magliano, Asst Principal Nick Cresta, guidance counselor Joan Irwin, social worker Heather Hahn, school psychologist Lynn Watts, guidance counselor Melanie Scapello, librarian (data diva) Caroline Brewer, guidance counselor Don Morgan, dean Ken Salamone, principal
The “Rules” • Decision rules for analyzing and matching students to appropriate interventions were designed by the team and tested (and revised) through the use of student data. Decision rules are used at every meeting. • At times, interventions were created to match the need. (Example: one student at risk for social skills was given leadership training and responsibilities within the Autistic support class.)
Making it work • Initially, based upon SWIS data, the target group in the fall was the freshman class for high school. The target groups for the winter in both schools were all students who were found significant for risk based upon the screeners and teacher input. • Additional data was collected for students who were not previously identified as at risk to be sure that 2nd /8thperiod was not just a difficult class at the time.
Custom Report of 4+ referrals per student was generated and downloaded into Excel for filtering when comparing with universal screener data to initially assign students to intervention groups.
Attendance reports and student class attendance and grades in the Quick Look up was analyzed when comparing with universal screener data to initially assign students to intervention groups and determine the efficacy of the interventions in place.
Data Based Decision Making Agenda • What students need to continue in the current intervention? • What students need to be added into an intervention? For what purpose / outcome? • What students need to be exited to the “watch” list? • From the “watch list,” what students need to be added, continued or exited?
Select Sample Fall-Winter Supports • Check and Connect • Tardy call group (using auto-call in the morning) • Mentoring • Small instructional groups: anger management, organization, coping skills, life skills • Counselor collaboration with special education case manager • Daily check-in • Referral to SAP • Relaxation group conducted by PE teacher • Individualized supports • Examples: • Working with county level judges in student contracting • Setting up leadership experiences for certain students, etc.
Winter 2013 Procedural Changes • By winter 2013, all participating schools requested that more immediate data be received than the pencil-paper administration could allow in order to evaluate progress and identify students in further need of help. • January 2013, both screeners were put onto an Excel sheet. Each classroom teacher assigned scores based upon the screeners’ descriptions and input data into an Excel workbook on the server. • As a result, a classroom profile was generated instantaneously with identification of students scoring no risk, moderate and significant risk. This information was later assimilated by grade level for further data analysis by the student management team.
File can be found: http://becky-millspaugh.wikispaces.com/Universal+Screener+Project Example Class Profile (Teacher) SRSS – Yellow: moderate risk Red: significant risk SSIS Yellow: 2 or 3 rubric (moderate) Red: 1 rubric (at risk) Green: 4 or 5 rubric (not at risk)
File can be found: http://becky-millspaugh.wikispaces.com/Universal+Screener+Project Sample Interventions assigned % of student population Example School/Grade Level Planning Profile 2 Universal Screener Scores
Lessons Learned • It’s important to analyze and use information as soon as possible to garner staff support in an endeavor like this at the secondary level. • Support teams have to define their role in PBS. They need to share these role definitions, results of data analysis and the identification of needs for intervention supports with the entire staff. • The staff on the tiered support teams (student management team) cannot be the only staff helping to run and coordinate interventions.