Download
1 / 26
270 likes | 787 Vues
Sustainable Agriculture. Impacts of Sprawl. -NRI 87-92 vs. 92-97 Conversions up from 1.2 Million Acres per year to 2.2 Million Acres per year. National Map. Conversions. American Converted 6,000,000 Acres from 92-97 (=~12Alabama Counties) Conversions are a one time crop. Alabama Map.

E N D
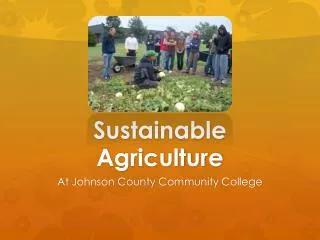
Sustainable Agriculture Sustainable Agriculture
Impacts of Sprawl • -NRI 87-92 vs. 92-97 • Conversions up from • 1.2 Million Acres per year to • 2.2 Million Acres per year Sustainable Agriculture
National Map Sustainable Agriculture
Conversions • American Converted 6,000,000 Acres from 92-97 • (=~12Alabama Counties) • Conversions are a one time crop Sustainable Agriculture
Alabama Map Sustainable Agriculture
Alabama’s Standing • State ranks 13th in total conversions • 87-92 130,000 Acres (26K/yr) • 92-97 315,000 Acres (63K/yr) • State ranks 10th in Prime Farmland losses to development Sustainable Agriculture
Top 20 Sustainable Agriculture
Growth Factors • Population Growth & Migration • 0.96% population growth • Cheaper Land • Transportation Corridor Development • Spreading Infrastructure • Larger Lots • 2% / yr lot size Sustainable Agriculture
Lot Size • 1950’s • Average < 1.0 acre / home site • 1997 • Average > 1.8 acres / home site Sustainable Agriculture
Other Factors • Absentee Ownership • Farm Revenue decreases • Off farm employment • Cheaper imports Sustainable Agriculture
Cost of Community Services Sustainable Agriculture
Hidden Costs • Emergency response time increases • Fire response time increases • Insurance (ISO) ratings decrease • School bus route time increases • (Police response time decreased) Sustainable Agriculture
Other Considerations • Smell • Dust • Slow vehicles • Chemicals Sustainable Agriculture
Environmental Impacts • Farmland / Open land • Storm water sponge • Heat Island sink • Air Quality buffer • All of these factors will have to be mitigated upon conversion Sustainable Agriculture
Food Production Sustainable Agriculture
Opportunity Lost • Eco Tourism • Heritage Trails • MicroFarm Enterprises • Anything other than Impervious Surfaces Sustainable Agriculture
Help? • Land Trusts • Up from 1 in the ’90’s to 7 in ’02 • Farmland Protection Program • $900,000 • Forever Wild • The Nature Conservancy Sustainable Agriculture
Options • Brownfield redevelopment • Greyfield redevelopment • Tax breaks • Mitigation Banks Sustainable Agriculture
Sloss Phytoremediation Sustainable Agriculture
Paul Kennedy USDA-NRCS 205.251-8139 x135 Paulk@cawaco.org www.cawaco.org