The Production Function
The Production Function Claudia Garcia-Szekely In This Lecture We build a model to describe a “generic” production process. The most common characteristics in production processes Translate those characteristics into a “model” – a set of equations and graphs-. Factors of Production


The Production Function
E N D
Presentation Transcript
The Production Function Claudia Garcia-Szekely ©2001Claudia Garcia-Szekely
In This Lecture We build a model to describe a “generic” production process. • The most common characteristics in production processes • Translate those characteristics into a “model” – a set of equations and graphs-. ©2001Claudia Garcia-Szekely
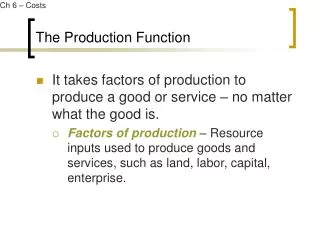
Factors of Production • To produce, an entrepreneur uses factors of production. • Factors of production are: • Labor (workers) • Land (a farm) • Capital (equipment, buildings) ©2001Claudia Garcia-Szekely
The Concept of Plant • A “plant” is the factory (space) where production takes place and • All the equipment necessary to produce • In other words is everything needed to produce, except workers and raw materials. ©2001Claudia Garcia-Szekely
Short Run vs. Long Run • The short run is defined as the period of time when the plant size is fixed. • The long run is defined as the time period necessary to change the plant. • The duration of the long run (and thus that of the short run) depends on the nature of the production process… ©2001Claudia Garcia-Szekely
The Nature of production • For a coffee shop: the long run is the time it takes to expand the coffee shop. • For a steel mill: the long run is the time it takes to expand the plant – to build an addition, add the new equipment- • The long run can be as short as a few weeks or as long as several months, depending on what is involved in expanding capacity to produce. ©2001Claudia Garcia-Szekely
Short Run vs. Long Run • In the short run, at least one factor of production is fixed (unchangeable) • In the long run, all factors of production can be changed… are “variable” ©2001Claudia Garcia-Szekely
Firms plan in the Long Run • At any point in time, a firm is restricted by (committed to) a specific plant size… • Firms never operate (produce) in the long run. • The long run is the planninghorizon…when all inputs are variable until you commit to a specific plant size. ©2001Claudia Garcia-Szekely
In the Short Run • Plant size is fixed. • This means that production is restricted to the capacity that you have in place at the moment. • To increase production, the only adjustment possible is to hire more workers or more labor hours (longer shifts). ©2001Claudia Garcia-Szekely
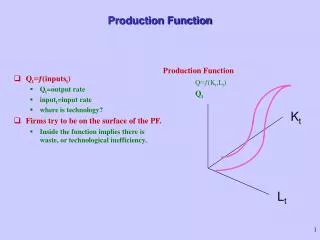
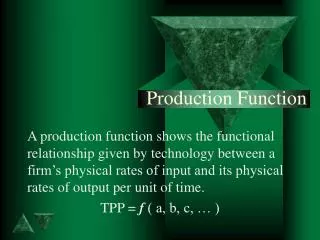
The Production Process Describes the relationship between inputs (Labor) and output (Q). ©2001Claudia Garcia-Szekely
There are three important ways to measure the productivity of inputs: • Total product (TP) • Average product (AP) • Marginal product (MP) ©2001Claudia Garcia-Szekely
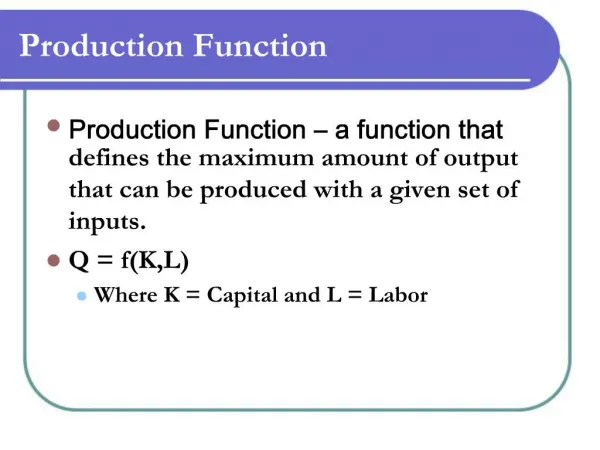
The Production Function (TP) • This function represents the relationship between the number of workers and the TOTAL number of units of output produced holding all other factors of production (the plant size) constant. • For a coffee shop, output would be measured in “number of coffee cups a day” • For a steel mill, output would be measured in “tons of steel produced a day” ©2001Claudia Garcia-Szekely
The Production Function: Output increases with L Q 27 25 20 Units Produced 8 Units of Labor L 1 2 3 4 ©2001Claudia Garcia-Szekely
Average Product (AP) • This function represents the average amount of output produced by each unit of labor. • Output per unit of input ©2001Claudia Garcia-Szekely
Rise Run AP: slope of ray from origin… Q AP (of 10 workers) = 15 TP 150 units Slope = 150/10 = 15 L 10
AP: slope of ray from origin… Q What happens to the Slope of the ray as L Increases up to Lo? AP Increases up to L0 The ray gets steeper: The slope increases L Lo L increases
AP: slope of ray from origin… What happens to the Slope of the ray as L Increases past Lo? Q AP Decreases after to L0 The ray gets flatter: The slope decreases L Lo L increases
AP: Slope of ray from origin… Q Q AP (slope of ray) Decreases after L0 AP (slope of ray) Increases up to L0 Lo Lo
AP: Increases, reaches a maximum and decreases. AP AP (slope of ray) Decreases after L0 AP (slope of ray) Increases up to L0 L Lo ©2001Claudia Garcia-Szekely
Marginal Product (MP) The additional output that can be produced by adding one more unit of labor, holding everything else constant. MP = DQ/DL The slope of the Total Product Function ©2001Claudia Garcia-Szekely
Rise Run MP: Slope of the Production Function Slope = 30/3 = 10 Q MP = 10 TP 160 units 30 130 units 3 L 9 12
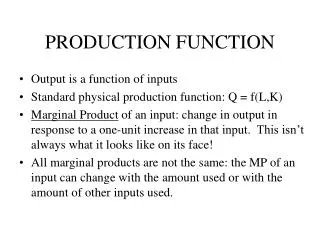
Choosing the Slope of the Production Function… To choose the slope we must consider the following: • The Slope of the Production Function is: (Rise) DQ / (Run) DL • How does production (Q) CHANGES when a new worker (L) is hired? ©2001Claudia Garcia-Szekely
The Slope of the Production Function Is called THE MARGINAL PRODUCT OF LABOR. MP ©2001Claudia Garcia-Szekely
The Marginal Product of Labor • Measures the change in output that occurs when one more worker is hired. • Short hand for Marginal Product of Labor : MP ©2001Claudia Garcia-Szekely
What happens to output as we hire more and more workers? • Remember that the plant size is fixed. • That means that you will be hiring more workers to SHARE the EXISTING EQUIPMENT and the EXISTING SPACE. ©2001Claudia Garcia-Szekely
A Coffee Shop • The plant will be the store, the tables, the coffee machines, etc. • When you add your first three workers, • One will make the coffee, the second will be the waiter and the third will manage the register. ©2001Claudia Garcia-Szekely
If you add a fourth worker • With two waiters, more customers can be served… • Output would probably increase a lot as you add more and more workers AT THE BEGINNING. • Eventually, adding new workers would begin to be counterproductive… • Workers will now need to wait to use the equipment… ©2001Claudia Garcia-Szekely
The most likely scenario • For most production processes, • Adding the first workers will be favorable to production as specialization increases productivity. • Eventually, adding more and more workers to a FIXED PLANT size would result in decreases in productivity due to “crowded conditions”. ©2001Claudia Garcia-Szekely
Diminishing Marginal Product Is the reduction in incremental output that occurs as more and more workers are added ©2001Claudia Garcia-Szekely
The Law of Diminishing Marginal Product. • As more of a variable input (labor) is added to a fixed input (plant), additions to output get smaller and smaller.. Note that adding workers increases output but the increases become smaller and smaller as more workers are hired. ©2001Claudia Garcia-Szekely
Negative MP • Diminishing Returns to labor (Decreasing MP) might turn into “reductions” in output (Negative Marginal Product). ©2001Claudia Garcia-Szekely
Choosing a Graph to show Diminishing Marginal Product To draw the production function we must choose a graph that shows: • The more workers we have the more output would be produced. For this, we need to draw and INCREASING FUNCTION. ©2001Claudia Garcia-Szekely
The Production Function: Output increases with L Q 27 25 20 Units Produced 8 Units of Labor L 1 2 3 4 ©2001Claudia Garcia-Szekely
Drawing a Typical Production Function • As we add more and more workers, additions to output - may increase at the beginning but - eventually decrease. For this, we need to draw a function with a slope that increases at the beginning, reaches a maximum and then decreases. ©2001Claudia Garcia-Szekely
The slope of the TP increases reaches a max and decreases Q 2 27 25 5 MP 20 Slope = 12 / 1 12 Slope = 5 / 1 Slope = 8 / 1 8 1 1 1 Slope = 2 / 1 8 L 1 2 3 4 1 ©2001Claudia Garcia-Szekely
The AP and MP… TP Slope of ray is max Changes concavity L MP is max AP is max MP,AP AP MP L ©2001Claudia Garcia-Szekely
Relationship between MP and AP MP AP MP = AP when AP is max MP above AP AP decreasing AP increasing AP MP below AP MP ©2001Claudia Garcia-Szekely
The Relationship between AP and MP • If MP (10) > AP (9), then the Average Product increases. • If MP (11) < AP (12), then the AP will decrease. • If MP = AP, then the AP is not increasing or decreasing: it is at the maximum point. ©2001Claudia Garcia-Szekely
Consider a small sandwich shop… ©2001Claudia Garcia-Szekely
AP L MP ©2001Claudia Garcia-Szekely
In the sandwich shop, as more employees are added to the fixed inputs, eventually MP falls. Diminishing Returns set in after the second worker AP MP ©2001Claudia Garcia-Szekely