Download

1 / 15
150 likes | 248 Vues
Explore how the Eastern Region Performance Network predicted the numbers of older people living at home through a needs-based model. The study emphasizes understanding predictors of social care needs and their implications for service provision. The research, conducted for ADSS Eastern Region, sheds light on the correlation between demographic data and care provision assessments. Tribal, a specialized consultancy firm, provides a wide range of professional support services, including change management and strategy implementation. The predictive model developed enables local authorities to align service provision with community needs effectively. The analysis highlights the importance of contextualizing performance evaluation to ensure efficient allocation of resources for better social care outcomes.

E N D
Eastern Region Performance Network Predicting the numbers of older people “helped to live at home” A needs-based model and its implications Project undertaken for ADSS Eastern Region – Project Chair Hugh Gault (Cambridge CC Social Services) BSPS Conference, University of Kent, 13 Sept 2005
Who is “Tribal”? • A leading provider of professional support services, offering a broad range of consultancy and managed services. • Employs over 2,000 people and operates from a network of 60 offices across the UK and Eire. • Operates across the public sector, within education; health and social care; local government, housing & regeneration; and central government. • Works with 80% of secondary schools; 75% of local authorities; 90% of further education colleges; and the majority of strategic health authorities and NHS trusts.
What does Tribal do? • Provides a wide range of services: • Change management • Performance improvement • Benchmarking • Executive resourcing & interim management • Organisational development • Direct service • Strategy development & implementation
Our hypothesis • Are authorities actually providing services at a level appropriate for the needs of their population? • If so, why is this not reflected in the performance judgements? • Can we identify predictors of need?
Social care needs model Older People No need for social care Private care Need for public social care Family networks Housing quality Health – mortality/ morbidity Income (IS) Voluntary organisations “Social Capital” Transport/access Preventive services Availability of private sector Self-funders/income
People who come in to the Social Services ‘domain’ Eligibility Criteria Assessments Referrals NO YES Care provision Res/NH care Intensive Voluntary organisations/direct access? Other HTLAH No service
Are there any predictors? Correlations with data from 2001 census and DWP - links to deprivation: • Older people living alone • Older people in rented accommodation • Index of Multiple Deprivation (IMD 2004) • Pensioners receiving Income Support • Pensioners in overcrowded accommodation
What about CSSR response? FSS is allocated according to deprivation factors £££ - The more youget, themoreyoucangive …and so you should!
The technical analysis • Started with full set of demographic data (IMD, Census and DWP) at LA level. • SPSS (stepwise regression) to identify the strongest predictors • Statistical tests to check robustness and statistical validity • Strongest combination of predictors: “lone pensioners” and “LLTI”
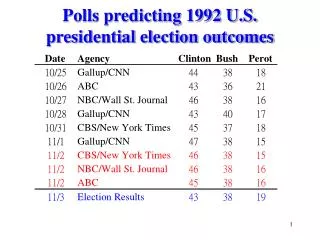
Predicted vs. actual PAF C32 PI • Predictive model demonstrates that you can use the demographic data to calculate indicative data for HTLaH • Compared this to the actuals for 2003 & 2004
So What? • Not all authorities have the same levels of community need • LA funding is based on assumptions of different need levels • The model isn’t perfect, but need levels can be predicted • Provision is generally consistent with predicted need levels
Messages for LAs and CSCI • “More does not necessarily equal better” • It’s wrong to assume that there is a universal linear target • Performance must be judged in context of community needs. • Trying too hard to “improve” may lead to wasteful allocation of scarce resources. • Research, benchmarking and needs mapping are essential to understanding performance