Download
1 / 40
400 likes | 529 Vues
Collaborative Spatial Ecological-Economic Modeling for Sustainable Management of Watershed Resources. Thomas Maxwell Alexey Voinov Robert Costanza. Collaborative Modeling. Realistic models require multiple teams Modelers typically not computer scientists

E N D
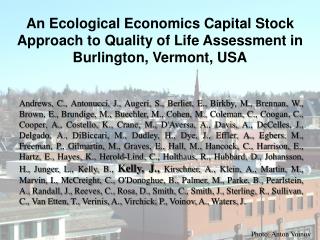
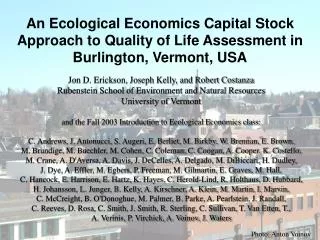
Collaborative Spatial Ecological-Economic Modeling for Sustainable Management of Watershed Resources Thomas Maxwell Alexey Voinov Robert Costanza Institute for Ecological Economics
Collaborative Modeling • Realistic models require multiple teams • Modelers typically not computer scientists • Stake holders must be integrated into the decision making process • Communication to a wide audience Institute for Ecological Economics
Three Stage Modeling Process • Scoping models • Consensus building • Research models • Understanding dynamics • Management models • Exploring scenarios Institute for Ecological Economics
Scoping Workshops • Constructivist learning. • Paradigm expansion. • (narrow,linear,static) -> • (broad,nonlinear,dynamic) • Conflict resolution. • Consensus building. • Collective decision making. • Develop management scenarios. Institute for Ecological Economics
Supporting Collaborative Modeling • Graphical modeling tools • Modular model development • Transparent high performance computing • Integrated data access • Integrated visualization • Variety of formalisms and frames Institute for Ecological Economics
Model viewed and manipulated graphically. • Opens model development to non-programmers. • Facilitates rapid development of models. • Enforces modeling standards. • Facilitates collaboration in model development. • Graphical representation serves as a blackboard. • Graphical Modeling Institute for Ecological Economics
STELLA Model Institute for Ecological Economics
Spatial Modeling Framework Institute for Ecological Economics
Two types of modules • Ecological Modules • No general theory. • Primary focus on modeling. • Examples: • Macrophytes, Epiphytes, Consumers, Phytoplankton • Modules developed in Stella/SME. • Physical Modules • Theory well known (e.g. Navier Stokes). • Primary focus on computation. • Examples: • hydrodynamics, atmospheric dynamics. • Modules developed externally and linked to SME. Institute for Ecological Economics
Typical State Variables • Examples of some typical state variables: • (Dissolved Inorganic) Nitrogen, Phosphorus • Water (Saturated, Unsaturated, Surface, Snow) • Detritus • Macrophyte (Non)Photosynthetic Biomass • Consumers • Deposited Organic Matter • Phytoplankton • Epiphytes Institute for Ecological Economics
Collaborative Spatial Modeling Workbench • Includes integrated support for: • Icon-based unit module development • Module archiving and reuse • Integration of multiple spatial representations • Distributed computing • Web-based modeling & simulation • Configuration, control, and visualization of remote simulations. • Data access and visualization • Real-time links to other apps (e.g. Swarm). • Spatial Modeling Environment Institute for Ecological Economics
Spatial Modeling Environment Module Repository Module Builder Simulation Driver Unit model Graphical modeling Spatial model HPC STELLA Code Generator PowerSim Module Constructor SME Module Editor Java Portal SMML Module Library Institute for Ecological Economics
SME Java Portal • Desktop access to remote supercomputing resources • Web-enabled ( using java servlets ) • Grid enabled ( using globus gram utility ) • Java applet <-> Java servlet <-> C++ apps • Portal interfaces include: • Workspace management • Module development • Model configuration • Simulation initialization, control, & visualization Institute for Ecological Economics
WorkSpace Manager Institute for Ecological Economics
Configuration Manager Documentation Panel Documentation of selected command Model Panel Hierarchical View of model objects Associated commands as boxes Command Panel Structure of selected command Property Panel Command Arguments Institute for Ecological Economics
Parameter Editor Edit Simulation Parameters Spreadsheet format Institute for Ecological Economics
Simulation Control Control Execution View Model Structure Trace Dependencies View Model Equations Configure Visualization Institute for Ecological Economics
SME Python Shell Institute for Ecological Economics
ViewServer Control Panel • Associates DataSets • with Viewers • Creates Viewers • Manages DataSets Institute for Ecological Economics
2D Animation Viewer • 2D Animation Control • Dynamic and manual rescaling • ColorMap editor • Data viewer (point/spreadsheet) • Export as GIF or JPG Institute for Ecological Economics
3D Animation Viewer • Dynamic Landscapes • Variable1 -> Altitude • Variable2 -> Color • Mouse controlled navigation Institute for Ecological Economics
Image Spreadsheet • Simultaneous display of variables at multiple timesteps • Useful for time series comparisons • Configure: start time, time step, magnification, scaling, etc. Institute for Ecological Economics
Numerical Spreadsheet • View spatial data • Attach to vis panels • Follows animation • Export to Stat packages. Institute for Ecological Economics
Agent Based Modeling in SME • Swarm agents can populate SME landscapes. • SME-Swarm integration: • http://iee.umces.edu/~villa/swarmsme • Swarm classes serve as wrappers for: • SME model. • SME grid layers. • SME spatial variables. • Two-way remote data transfer. • Built on SNI simulation server architecture: • http://iee.umces.edu/~villa/sni Institute for Ecological Economics
Multi-Grid Library • Integrates multiple spatial representations • Implements space in SME • Major Components include: • Cell: Spatially referenced area (or volume) element. • Grid: Distributed set of Cells + links. • Frame: Hierarchy of distributed Grids. • Link: Connection between Cells. • Intra-Grid: spatial contiguity. • Inter-grid: scaling relations or mappings. • Activation Layer: Subset of Cells in a Frame. • Coverage: Mapping:: Activation Layer -> floats. Institute for Ecological Economics
Distributed Processing • Spatial grid • partitioned over processors • Highly parallel application • Recursive N-section: • excellent load balancing • Fully transparent to user Institute for Ecological Economics
Model Calibration toolkit • Built on MPE toolkit: • http://iee.umces.edu/~villa/svp/ • Calculate performance measure (MPE) • Estimate of match between model & system. • Weighted sum of tests (Bounds, Theil, Freq, etc). • Search parameter space to maximize MPE. • Evolutionary and gradient searches. • Params, tests, & searches configured in SME. Institute for Ecological Economics
Example Applications • Everglades Landscape Model • http://www.sfwmd.gov/org/erd/esr/elm/intro/welcome.htm • Patuxent Landscape Model • http://iee.umces.edu/PLM • Baltimore Ecosystem Study • http://baltimore.umbc.edu/lter • Great Bay Estuarine Model • http://iee.umces.edu/GrBay • Illinois TES Models • http://blizzard.gis.uiuc.edu/ • IGERT & CoreModels programs Institute for Ecological Economics
Environmental Modeling Workbench Spatial Modeling Environment Inputs to multiple models Coupled Bio-Hydro Simulation Integrated wireless Sensor web CavernSoft Collaborative Environment Institute for Ecological Economics Environmental Hydrology Applications Team
Links components: Circulation (OM3) Ecology (SME) Atmospheric coupling Chesapeake Bay Model Institute for Ecological Economics Environmental Hydrology Applications Team
Collaborative Virtual Environment Chesapeake Bay data in CVE with Cave5D/Virtual Director Institute for Ecological Economics Environmental Hydrology Applications Team
SME Landuse Evolution and Impact Assessment Model LEAM, University of Illinois at Urbana-Champaign Institute for Ecological Economics
economic population social geography transport open space neighbor- hood random fiscal energy waste environ water air habitat tes LEAM Framework L E A M model drivers simulation planning group planning group landuse change impact assessment sustainable indices Institute for Ecological Economics
LEAM Portal Institute for Ecological Economics
Patuxent Landscape Model(PLM) • Resolution - 1 km (200m for subwatersheds) • 2562 grid cells • A model in each cell: hydrology nutrients (N, P) vegetation • Forcing functions: climatic conditions land use map nutrient loadings from • -atmosphere -fertilizers -septics -point sources Institute for Ecological Economics
State variables and main processes in the landscape model Institute for Ecological Economics
Library of Hydro-Ecological Modules Institute for Ecological Economics
Main Drivers • Landuse change - number if cells in different habitat categories and their patterns • The total amount of nutrients that is contributed annually from various sources to the watershed. At this time atmospheric deposition is the main source of non-point pollution Institute for Ecological Economics
Results • historical land use in 1650, 1850, 1950, 1972, 1990 and 1997; • a “buildout” scenario based on fully developing all the land currently zoned for development; • four future development patterns based on an empirical economic land use conversion model; • agricultural “best management practices” which lower fertilizer application; • four “replacement” scenarios of land use change to analyze the relative contributions of agriculture and urban land uses; and • two “clustering” scenarios with significantly more and less clustered residential development than the current pattern. We analyzed 18 scenarios including Institute for Ecological Economics
SME Distribution The SME home page: http://www.uvm.edu/giee/SME3/ Includes: • Overview. • Technical documentation. • Publications. • Source code (C++ and java). • Links Institute for Ecological Economics