Download

1 / 27
270 likes | 493 Vues
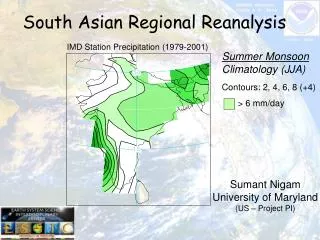
The Regional Reanalysis Team at the Climate Prediction Center Marco Carrera, Kingtse Mo, Wayne Higgins, Jae Schemm, Muthuvel Chelliah, Wesley Ebisuzaki, Wei Shi, Hyun-Kyung Kim, Evgeney Yarosh, and Yucheng Song. Regional Reanalysis Climatology.

E N D
The Regional Reanalysis Team at the Climate Prediction Center Marco Carrera, Kingtse Mo, Wayne Higgins, Jae Schemm, Muthuvel Chelliah, Wesley Ebisuzaki, Wei Shi, Hyun-Kyung Kim, Evgeney Yarosh, and Yucheng Song Regional Reanalysis Climatology North American Regional Reanalysis Workshop 11 January 2005 San Diego, CA
Objectives and Outline • Investigate the seasonal cycle of precipitation, surface temperature and the large-scale aspects of the hydrological cycle over North America from the perspective of the Regional Reanalysis (RR) analysis and forecast products. Outline • Examine the seasonal cycle of precipitation and surface temperature; • Moisture budget terms; • Low-level jets; • Conclusions.
Regional Reanalysis (RR) • Model : Eta regional model and data assimilation system; • Resolution : 32km, 45 vertical levels, 3hourly; • Base Period for climatology : 1 Jan 1979 – 31 Dec 2001; • Domain : North America and adjacent oceans. • Precipitation assimilation: • US : PRISM corrected gauge analysis; • Mexico, Canada : Rain gauge analysis; • other areas (equatorward of 42.5oN) CMAP pentad analysis (1979 - 2002) CMORPH hourly precipitation analysis (2003 - )
Precipitation and Surface Temperature • Precipitation and surface temperature from the RR compare favorably with observations. • Surface temperatures are not assimilated over land. • The seasonal cycle of precipitation is well captured by the RR; • Relationships between E and P in the RR are consistent with those reported by Rasmusson (1967, 1968) and Berbery et al. (1996).
Annual Cycle of Precipitation (mm day-1) Warm Season May:Heaviest P in the western Gulf Coast and lower Mississippi Valley. June:P reaches a maximum over the Central US, while monsoon rainfall spreads northward along the western slopes of the Sierra Madre Occidental. July:Monsoon P shifts northward into AZ/NM by early July while P decreases in Central US. August:Monsoon P reaches a maximum over SW and then starts to retreat. The demise of the monsoon is more gradual than the onset.
Precipitation Difference (mm day-1) (RR-Unified US/Mexico) : Warm Season RR assimilates observed P, so the differences between the RR and observed are expected to be small. Largest differences are over southern Mexico where the difference is about 8%.
Comparison between Free Forecasts and the RR (1998-2002) 0-3 hr forecasts have more precipitation over land and are dryer over the oceans. The differences between 3-hr Fcst and the RR can be as large as 4 mm day-1. Some of the differences are due to spin up. The differences between the 12-hr Fcst and the RR show the same pattern but magnitudes are smaller.
Annual Cycle of Precipitation (mm day-1) Cold Season Nov-Dec Precipitation extends from the Pacific Northwest southward to California Jan- Feb Rainy season in California March-April Rainfall retreats northward
Precipitation Difference (mm day-1) (RR-Unified US/Mexico) : Cold Season Large differences over the western regions of the US may be due to the PRISM correction. PRISM is used for the assimilated precipitation in the RR, but not for the Unified analyses.
Annual cycle of Precipitation (mm day-1) in Various Regions Winter regime:Pacific Northwest and California Summer Regime:Central US & Mexico Mid-Summer Minimum: Southern Mexico, Southern Plains Weak seasonal cycle: Southeast RR(red) ; Unified US/Mexico (black)
Annual Cycle of 2 meter air Temperature (T2m) (°C) (warm season)
Temperature Difference (oC) (RR T2m –OBS Surface Temp) (Warm Season) Largest differences found over the high terrain of the western US where the RR possesses a cold bias. RR possesses a positive bias over the central part of the US.
Temperature Difference (oC) (RR T2m –OBS surface Temp) (Cold Season) Largest differences found over the high terrain of the western US where the RR again possesses a cold bias.
Cold Season (DJF) Moisture Terms P-E P Over the western region, contribution to P is from DQ, E is small. -DQ E Two branches of moisture fluxes: one to the Pacific Northwest and another to California
Warm Season (JAS) Moisture Terms P-E E>P over the central US. P qflux -D(Q) 3 Low level Jets CALLJ: Caribbean GPLLJ:Great Plains GCLLJ: Gulf of California E E
Seasonal Cycle of Moisture Budget Parameters (32oN-36oN) E>P over the central US in summer D(Q) contribution over the central US is small Both E and D(Q) contribute to rainfall over the Southwest (E-P) P -DQ E Results are consistent with Rasmusson (1967,1968).
Low-Level Jets (LLJ) • The LLJ from the Caribbean (CALLJ) is well captured by the RR. • The Great Plains LLJ (GPLLJ) in the RR is similar to that in the operational EDAS and compares well to the wind profiler data. • The Gulf of California LLJ (GCLLJ) is too strong compared to observations.
Mean Diurnal Cycle of Meridional Wind (m s-1) at (36oN,97.5oW) (GPLLJ) JJA 1994 Higgins et al. 1997 Wind profiler Max: RR 900-950 hPa Profiler: Below 950 hPa RR
Meridional Wind (m s-1) at (36oN,97.5oW) (GPLLJ) Strongdiurnal cycle: max 930-960 hPa Strongdiurnal cycle: max 250-500 m AGL Wind Profiler RR 1 Higgins et al. (1997)
GCLLJ as depicted by [qv] • When the RR is compared to the operational EDAS, the GCLLJ appears to be too strong and less variable. • The largest values in the RR are concentrated in the northern Gulf of California. The RR captures the diurnal cycle of the meridional winds as indicated by the sounding data at Puerto Peñasco, but the magnitude is about 3 - 4 m s-1 higher . • Vertically, the jet depicted by the RR extends above 850 hPa while the operational EDAS shows a more shallow jet confined below 850 hPa.
Vertically Integrated Meridional Moisture Flux [kg (ms)-1] (1995-2000) RR RR - OpEDAS RR [qv] Over the Gulf of California the vertically integrated meridional moisture fluxes are stronger in the RR when compared with the EDAS Differences can be as large as 60 kg m-1s-1 June July August September
RR, pilot balloon and soundings at Puerto Peñasco (31.3oN,113.6oW) RR 252-m observed wind (Douglas et al. 1998) 31 July – 14 August 1995 Profile of v-wind (obs) RR v-wind captures the diurnal cycle but it is 3 m s-1 higher than observed 31 July – 14 August 1995 1 LT 1LT 16 LT 16LT
Vertical cross-section of qv at 30oN 1998-2000 RR Operational EDAS GPLLJ RR compares well with EDAS GCLLJ RR: Large qv values extend above 850 hPa EDAS: Large qv values are confined below 850hPa July Aug Sep
Challenges The NAME (North American Monsoon Experiment) data will give guidance to: • the location, strength and variability of the GCLLJ, • the structure and diurnal cycle of P and the GCLLJ, • relationships between P and the GCLLJ. We need to understand: • The reason why the GCLLJ is stronger in the RR when compared with the operational EDAS?
Availability of the CPC RR Climatology • RR Climatology is available from UCAR JOSS http://www.joss.ucar.edu/name/dm/archive/ • 3 hourly climatology of a limited number of fields; • Daily climatology; • Monthly mean climatology; • Detailed information on the climatologies can be found on the RR website at: http://wwwt.emc.ncep.noaa.gov/mmb/rreanl/
Comparison of Various Parameters at Empalme Douglas and Leal (2003) RR