1 / 2

R=0.79, p<0.001

A. C. R=0.79, p<0.001. R=0.79, p<0.001. B. D. R=0.77, p<0.001.

otto-wilder
Télécharger la présentation

R=0.79, p<0.001

An Image/Link below is provided (as is) to download presentation Download Policy: Content on the Website is provided to you AS IS for your information and personal use and may not be sold / licensed / shared on other websites without getting consent from its author. Content is provided to you AS IS for your information and personal use only. Download presentation by click this link. While downloading, if for some reason you are not able to download a presentation, the publisher may have deleted the file from their server. During download, if you can't get a presentation, the file might be deleted by the publisher.

E N D

Presentation Transcript


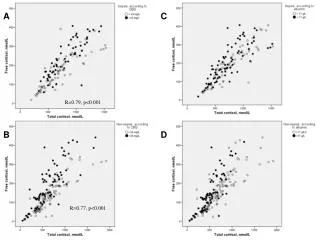
  1. A C R=0.79, p<0.001 R=0.79, p<0.001 B D R=0.77, p<0.001

  2. Fig: Free (measured by equilibrium dialysis) versus total cortisol at baseline, 30 and 60 min after ACTH injection in the critically ill with sepsis (AC) or non-sepsis (BD), according to dichotomized levels of cortisol binding globulin (CBG; panels AB) and albumin (panels CD). R=partial correlation coefficient.

More Related