Download
1 / 32
320 likes | 464 Vues
OUTPUT AND COSTS. Goals of the firm. Profit Maximization : The firm attempts to maximize the difference between total revenue and total cost of production. Total Revenue (TR) is the amount earned from selling the product of the firm. It is the Dollar value of sales. TR = Price * Quantity.

E N D
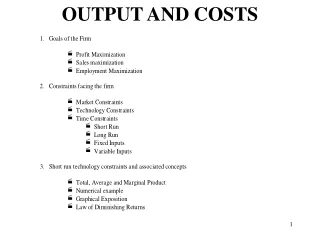
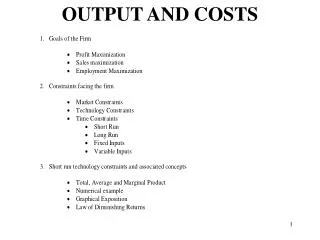
Goals of the firm • Profit Maximization: The firm attempts to maximize the difference between total revenue and total cost of production. • Total Revenue (TR) is the amount earned from selling the product of the firm. It is the Dollar value of sales. TR = Price * Quantity
Goals of the firm • Sales Maximization: The firms’ primary goal is to maximize the amount of sales. Profits take a backseat. This may be an attempt to capture market share through brand recognition which may be viewed as a first step towards profit maximization. Firms may pursue brand recognition for other reasons such as gaining the confidence of potential investors.
Goals of the firm • Employment Maximization: The primary goal of the firm is to maximize the number of employees. Typically employment maximization does not go hand in hand with profit maximization. However, in some instances pyramid schemes such as Amway rely on a large number of employees to compete effectively against firms with established distribution networks.
Constraints facing the firm • ·Market Constraints: They are the price and quantity constraints that face a firm in the purchase of inputs (such as land, labor and capital) and the sale of outputs (the products of the firm). In other words the firm is bound by market forces to pay the going wage rate for labor, the going interest rate for bank loans etc. By the same token a firm has to price its’ product according to the market.
Constraints facing the firm • Technological Constraints: Technological constraints limit how the firm can use inputs to combine outputs. In other words, it is the technology that determines how much a given set of factors of production can produce.
Constraints facing the firm • For example, a student with access to the internet and online databases today can write an excellent term paper in a shorter amount of time than a student who does not have access to these resources. Generally improvements in technology allow the firm to produce improved products in greater quantities often in a shorter amount of time and at lower cost.
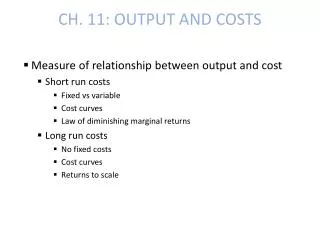
Constraints facing the firm • Time Constraints: The amount of time a firm has to make a decision about inputs (land, labor, capital etc) or output (amount to be produced) and the pricing of output. In a challenging business climate firms often have to make rapid decisions. It is generally the firms that make good decisions under pressure or firms that anticipate decisions in advance that succeed. In economics we divide time into the short run (SR) and the long run (LR)
Constraints facing the firm • oShort Run: The short run is a period of time in which the quantity of at least one input cannot be changed by the firm. The firm can change quantities of all other inputs. For example if a bookstore wanted to expand into the space next door, it may take a little time to expand the store.
Constraints facing the firm • Long Run: The long run is a period of time long enough for the firm to adjust the amounts of all inputs. • o Fixed Inputs: Fixed inputs are those inputs whose amount cannot be changed by the firm in the short run. Example: Expanding the book store to the store next door may not be done in the SR. • o Variable Inputs: Variable Inputs are those inputs whose amount can be easily changed by the firm in the short run. Example: Hiring new sales associates to expand the labor force.
Total, Average and Marginal Products • Total Product: The total product curve shows the maximum amount of output that can be obtained from a given amount of the fixed input as the amount of the variable input is adjusted. For example the total product curve of a jean factory would show the maximum amounts of jeans produced for different amounts of labor and raw materials given a fixed number of jean machines.
Total, Average and Marginal Products • Average Product: APL = TP / L The average product of an input is the total product divided by the total amount of the variable input used in production. • Marginal Product: MPL = TP/L The marginal product of an input is the increase in total output from an additional unit of the input. For example the number of jeans produced by one more work-hour.
Law of Diminishing Returns • The law of diminishing returns states that as a firm uses more of a variable input without changing the quantity of fixed inputs, the marginal product of the variable input will eventually decline (because its productivity will be affected by the lack of the fixed input).
Law of Diminishing Returns • For example: Consider a factory with 10 jean machines. Suppose one machine can be used by one worker. The first ten workers can each have a machine. The next few can carry raw materials for those on the machines. However eventually you get to a point where additional workers are just standing around getting in each others way. Eventually the MP of each additional hour worked will decline due to the bottleneck in the number of machines. • The law of diminishing returns is the reason why TP, AP and MP curves rise reach a max and then fall.
Fixed & Variable Costs • A fixed cost is one that does not change with the volume of output produced. (Ex: The rent on your factory space stays the same regardless of how many jars of Salsa you produce) • A variable cost is one that depends upon the volume of output produced. (Ex: The more Salsa you make the more you spend on raw materials like spices, tomatoes etc.)
Costs & Salsa TFC = Rent on Land + Rent on Machines TVC = Wages + Raw Material Costs TC = TFC + TVC
TFC, TVC & TC Curves • TFC is a horizontal line because fixed costs do not change with the quantity produced. (Rent for the factory does not change with how much Salsa you make) • TVC has an inverse S shape because of the law of diminishing marginal product. • TC is parallel to TVC and is higher than TVC by the amount of TFC.
Marginal Cost • Marginal cost is the change in total cost resulting from a one unit increase in output.
Points to note about MC • MC is independent of fixed costs. A change in fixed costs (like rent) will not change MC. (except for the first unit) • MC = (TC2 – TC1)/(Q2 – Q1) = (TFC2 + TVC2 – TFC1 – TVC1)/(Q2 – Q1) = (TVC2 – TVC1)/(Q2 – Q1)
Points to note about MC • MC is obtained by plotting the slope of TC at each point against quantity (Q). • Total fixed cost (TFC) gets absorbed into the MC of the first unit and does not affect MC after that. • MC is U-shaped because of the law of diminishing marginal product.
Average Costs AC, AFC & AVC • The average cost of production is defined as the total cost divided by the number of units of output. • AC = TC/Q = (TFC + TVC)/Q = TFC/Q + TVC/Q = AFC +AVC
Points to note about Average Costs • AFC is downward sloping because as more units get produced the fixed costs get spread out over a larger volume resulting in lower and lower AFC. (A rent bill of $500 spread out over a 100 bottles of salsa is an AFC of $5, but the same rent amount of $500 spread out over 500 bottles of salsa is just $1)
Points to note about Average Costs • AVC is U – shaped because of the law of diminishing MP. • As more labor is hired the MP of labor rises (jars of salsa produced per hour go up). Now as workers are producing more and more per hour at the same wage the variable cost per jar is going down. ( For example a worker making $10 an hour that produces 50 jars implies a labor cost of $1/5 of a dollar. If he/she produces more jars per hour the labor cost per jar will fall. • As more labor is hired eventually MP declines and the variable costs due to the variable input (labor) per jar will go up. • Thus AVC declines reaches a minimum and then rises as Q increases.
Points to note about Average Costs • AC is U-shaped. It falls at first as Q increases due to a falling AFC and a falling AVC. Then the rising AVC outweighs the falling AFC and AC rises. The AC has a u-shape in part due to the shape of AFC and in part due to the shape of AVC.
Points to note about Average Costs • AC is derived by plotting the slope of the ray from the origin to each point on the TC curve against the Quantity Q at that point. • A rise (fall) in TFC or TVC shifts TC up (down) and thus also shifts AC up (down)
Summary of SR Average & Marginal Cost Curves • MC cuts ATC and AVC at their minimum points. • MC is u-shaped • MC lies below ATC & AVC when they are falling and above ATC & AVC when they are rising • Changes in FC shift AC but not AVC & MC. Changes in variable costs shift AVC & MC but not AFC • AC & AVC are u-shaped
Long run Average Cost • The LRAC is the locus of points denoting the least average cost of producing a given output level from all available plant sizes. • LRAC is the lower envelope of the SRAC curves. • LRAC is U-shaped because of the laws of returns to scale (RTS)
Long run Average Cost: • Increasing RTS: As all inputs are increased by some proportion alpha (say 10%) output increases by more than that proportion (i.e. more than 10%) • Decreasing RTS: As all inputs are increased by some proportion alpha (say 10%) output increases by less than that proportion (i.e. less than 10%)
Long run Average Cost: • Constant RTS: As all inputs are increased by some proportion alpha (say 10%) output increases by exactly that proportion (i.e. 10%) • Economists claim that the falling part of LRAC is due to IRS and finally when a firm gets too big and DRS set in, the LRAC starts to rise.