Kinematics Graphs
Kinematics Graphs. One-Dimensional Motion Graphs provide an easy tool for understanding and communicating how objects move . Objectives to learn how to interpret kinematics graphs in the study of physics. Using technology to determine position, speed, and acceleration.

Kinematics Graphs
E N D
Presentation Transcript
Kinematics Graphs One-Dimensional Motion Graphs provide an easy tool for understanding and communicating how objects move.Objectives to learn how to interpret kinematics graphs in the study of physics.
Using technology to determine position, speed, and acceleration THE MOTION DETECTOR: Often times in physics class we use a device called a motion detector to sonically range our location from a computer data acquisition probe. The following slides are examples of real data take from such a device and computer data analysis set up.
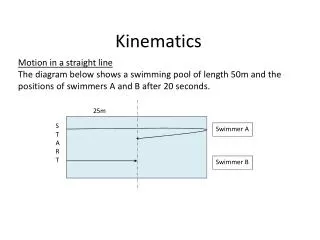
Distance (postion) vs. Time Graphs An example of a Distance vs. Time graph is shown below
The Velocity vs. Time graph is shown below: This data was recorded by moving a cart in front of a motion detector on a long track. Similar to the set up shown in the figure above.
Drawing a Velocity vs. Time GraphAnalysis from Distance vs. Time data
Working backward? We will now show you a velocity graph and then the distance graph in an animation…
Relating the Equations to Graphs • If you are given any kinematics graph (e.g. Velocity vs. Time), you can use that to determine other graphs (e.g. Distance vs. Time or Velocity vs. Time) using the 3 kinematics equations of motion. Below is an example... Given the following Velocity vs. Timegraph...
The corresponding Acceleration vs. Timegraph is shown below:
Another example of using graphs and equations is given below.. • Suppose you are given the following Acceleration vs. Time graph. • You can find the corresponding Velocity vs. Timegraph using the 1st equation of motion.
The corresponding Velocityvs. Time graph is shown below: Using both the Velocity vs. Timegraph as well as the Acceleration vs. Time graph, we can determine the Displacement vs. Time graph using the second equation of motion:
The corresponding Displacement vs. Time graph is shown below. Note each line segment on theVelocityvs. Time graph corresponds to a parabola on the Displacement vs. Time graph.
Calculating the Average Velocity • Average velocity is related to the Total Displacement and Total Time as follows: For the above graph, the Average Velocity can be calculated as follows. Note that the average velocity is also the mean of the initial (v0)and final (v) velocities in the time interval.
Physics Simulations and Tools There are a number of great tools that can be used to help you understand how to make these graphs and motion seem sensible. One of them is housed at the PhET site at the university of Colorado. Take time to go out and play with the Moving Man software. It is free and has proven to be useful to a number of students. In the past. http://phet.colorado.edu/en/simulation/moving-man
More physics simulations and tools There are a number of great tools that can be used to help you understand how to make these graphs and motion seem sensible. One of them is housed at the Addison Wesley textbook site called Activphysics. Take time to go out and play with the various problem set examples. It is free and has proven to be useful to a number of students in the past. http://wps.aw.com/aw_young_physics_11/13/3510/898587.cw/nav_and_content/index.html
Now that you understand how to describe motion in many methods… You will change your focus to applying the concepts of the mathematical tool known as the “Vector” to also assist you in making calculations related to kinematic quantitates.Follow the arrow you continue along the path into the next part of the lesson on Vectors.
Vectors Objectives:By the end of this lesson you will be able to apply the mathematical properties of vectors to additional vector based physics problems.Additionally, You will understand vectors in multiple forms: i.e.A vector is a quantity that has both magnitude and direction. For instance, velocity is a vector, because it has two pieces of information1) How fast something is moving.2) In which direction it is moving.
Representing Vectors Often, it is inconvenient to draw pictures to represent something, so people still look for ways in which to describe it merely with numbers, even if they have to use more than one number.
Rectangular or Cartesian Representation. • The two numbers Ax and Ay are called the components of the vector A. (Note: Vectors are usually denoted with bold face letters, or letters with arrows above them.) • So Vector A = (Ax , Ay) or in this example A = (68.9mph, 12.2mph)This representation is called the rectangular or Cartesian representation.
Polar representation. There is another way in which you can represent a vector using two numbers: Polar representation.In a way we have already been using this representation. Basically the two numbers are the length (magnitude) of the vector and the direction (angle measured with respect to the positive 'x' axis in the counterclockwise direction).
Vector Algebra: Adding and Subtracting Vectors When adding and subtracting vectors, it is most convenient to do so in the Cartesian representation.So if you are given, two or more vectors in the Polar representation, first convert them to the Cartesian representation, and the add or subtract them.Suppose: A = (Ax , Ay) and B = (Bx, By) • Then, if C = A + B, you have C = (Cx, Cy), whereCx= Ax + Bxand Cy = Ay + By • Also, if D = A - B, you have D = (Dx, Dy), whereDx= Ax - Bxand Dy= Ay - By
To your chapter for problem sets. You should now have a basic understanding of how to represent motion via a number of methods. These multiple representations are the best way I know to help you learn to understand the applications of motion in physics.Ask your instructor for any specific homework assignment beyond this point.