Download
1 / 41
410 likes | 545 Vues
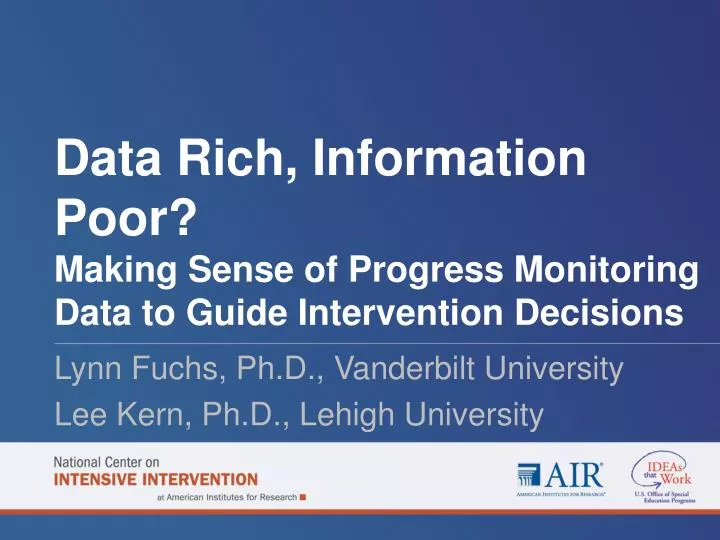
Data Rich, Information Poor? Making Sense of Progress Monitoring Data to Guide Intervention Decisions. Lynn Fuchs, Ph.D., Vanderbilt University Lee Kern, Ph.D., Lehigh University. Purpose.

E N D
Data Rich, Information Poor? Making Sense of Progress Monitoring Data to Guide Intervention Decisions • Lynn Fuchs, Ph.D., Vanderbilt University • Lee Kern, Ph.D., Lehigh University
Purpose Help educators understand how to review progress monitoring and other accessible data to guide intervention planning for students with intensive needs in behavior and academics.
We will discuss • Common progress monitoring measures in academics and behavior • Key considerations for optimizing data collection • Structured questioning for analyzing progress monitoring data patterns: • What patterns do the data reveal? • What might the data reveal about the student’s needs? • What adaptations may be needed to make the intervention more effective?
1. Common Progress Monitoring Measures in Academics and Behavior
Quick Review:What is progress monitoring? • A standardized method of ongoing assessment that allows you to • Measure student responseto instruction/intervention • Evaluate growth and facilitate instructional planning • For more information about progress monitoring: • www.intensiveintervention.org; www.rti4success.org • Tools • Charts • Training modules
Progress Monitoring Tools Should Be • Brief assessments • Repeated measures that capture student learning or behavior over time • Measures of grade, age, or instructionally appropriate outcomes • Reliableand valid
Common Progress Monitoring Measures: Academics Reading • Letter Sound Fluency • Word Identification Fluency • Oral Reading Fluency; Passage Reading Fluency • Maze Mathematics • Number Identification • Quantity Discrimination • Missing Number • Computation Curriculum-Based Measures • Concepts and Applications Curriculum-Based Measures
Common Progress Monitoring Measures: Behavior • Direct Behavior Rating • Systematic Direct Observation
Common Progress Monitoring Measures: Behavior Systematic Direct Observation 10
Common Progress Monitoring Measures: Behavior M W Tu Th F Direct Behavior Rating
Graphing Progress Monitoring Data Disruptive Place a mark along the line that best reflects the percentage of total time the student was disruptive during mathematics today. Interpretation: The student displayed disruptive behavior during 30 percent of small-group science instruction today.
Common Challenges: Academic Data • Aligning measure to content of instruction • Sensitivity to change • Distinguishing from other classroom-based and diagnostic assessments • Frequency of data collection
Common Challenges: Behavior Data • Defining target behavior • Aligning measure with target behavior • Consistency of administration and frequency of data collection
3. Structured Questioning for Analyzing Progress Monitoring Data Patterns
Structured Questioning I • Am I collecting data often enough? • Is the progress monitoring tool sensitive to change? • Does the measure align to the content of the intervention? • Am I collecting data at the right level?
Structured Questioning I • Did the student receive the right dosage of the intervention? • Did the student receive all components of the intervention, as planned? • Did other factors prevent the student from receiving the intervention as planned? (Example: absences, behavior issues, scheduling challenges, group size, staff training)
Structured Questioning I • Is the intervention an appropriate match given the student’s skill deficits or target behavior? • Is the intensity of the intervention appropriate, given the student’s level of need, or are adaptations or intensifications needed? • Are academic and behavioral issues interrelated?
Trend: Improvement in Scores After Change (Behavior) Pre-intervention After intervention change The situation: Responding improves more after an intervention change, with an ascending trend.
Trend: Improvement in Scores After Change (Academic) The situation: Scores improve more after an intervention change, making the trend line steeper than it was.
What could this pattern be telling you? • This is good news! • The student is steadily improving and is on target to reach the end of year goal. • Continue to monitor progress to ensure ongoing improvement. • Consider creating a more ambitious goal if the student continues to outperform the goal.
Trend: Flat Line (Behavior) After intervention change Pre-intervention The situation: The data from the intervention phase is similar to pre-intervention or baseline, creating a flat or stable trend.
Trend: Flat Line (Academic) The situation: Data in the intervention phase is similar to the baseline phase, creating a flat trend line.
What could this pattern be telling you? • The student is not responding to the intervention. • The progress monitoring tool is not appropriate. • The student has not received the intervention with fidelity. • The intervention is not an appropriate match for the student’s needs.
Target specific student need or function of behavior and determine more appropriate match. • Add motivational or behavioral component. • Add academic supports. • Modify schedules of reinforcement. • Select progress monitoring measure that aligns with intervention. • Ensure progress monitoring tool is sensitive to change. • Ensure the behavior measurement reflects the behavior you need to change. • Address barriers to adequate dosage and fidelity.
Trend: Highly Variable (Behavior) After intervention change Pre-intervention The situation: The data from the intervention phase is similar to pre-intervention or baseline, creating a variable trend. Disruptive DBR Rating Number of School Days
Trend: Highly Variable (Academic) The situation: Scores are highly variable, with significant changes from day to day.
What could this pattern be telling you? • Theprogress monitoring tool is not reliable. • Administration of the assessment is inconsistent. • Engagement and motivation vary greatly by day. • Other situational or external factors affect performance or behavior.
Verify that progress monitoring tool has evidence of reliability. • Ensure consistency of administration. • Ensure consistency of intervention delivery and dosage. • Create plan to help student manage situational factors. • Add motivational or behavioral component.
Trend: Slow Rate of Improvement (Behavior) Engagement DBR Rating After intervention change The situation: The data in the intervention phase is increasing but slowly, creating a gradual ascending trend. Pre-intervention Number of School Days
Trend: Slow Rate of Improvement (Academic) The situation: The student’s scores are improving, but not as steeply as the goal line.
What could this pattern be telling you? • The student is making some progress, but at a slow rate. • Continuation will not result in student reaching goal. • The goal is inappropriate for the measure being used or student characteristics. • The student requires an intervention change to increase intensity.
Set feasible goal by researching rate of improvement. • Increase intensity by increasing frequency or duration of intervention or decreasing group size. • Increase intensity by • Providing more frequent opportunities for feedback • Adding explicit instruction in skill deficit area • Adding practice opportunities
In Summary • Begin with a valid, reliable, and appropriate progress monitoring measure. • Graph your data to see patterns. • Ask questions about data patterns to arrive at hypothesis about student responsiveness. • Use your hypothesis to inform changes to intervention or assessment (if the data indicate that a change is needed).
Additional Resources • Center on Response to Intervention: www.rti4success.org • National Center on Intensive Intervention, DBI Training Series: http://www.intensiveintervention.org/content/dbi-training-series • National Center on Student Progress Monitoring: http://www.studentprogress.org/
National Center on Intensive Intervention (NCII) • E-Mail: NCII@air.org • 1050 Thomas Jefferson Street, NW • Washington, DC 20007- 3835 • Website: www.intensiveintervention.org • While permission to redistribute this webinar is not necessary, the citation should be: • National Center on Intensive Intervention. (2014). Data Rich, Information Poor? Making Sense of Progress Monitoring Data to Guide Intervention Decisions. Washington, DC: U.S. Department of Education, Office of Special Education Programs, National Center on Intensive Intervention.
National Center on Intensive Intervention This webinar was produced under the U.S. Department of Education, Office of Special Education Programs, Award No. H326Q110005. Celia Rosenquist serves as the project officer. The views expressed herein do not necessarily represent the positions or policies of the U.S. Department of Education. No official endorsement by the U.S. Department of Education of any product, commodity, service or enterprise mentioned in this presentation is intended or should be inferred.