Download
1 / 23
230 likes | 352 Vues
The Q1 2012 report by Nielsen reveals a growing trend in global advertising expenditure, with consumer confidence on the rise, leading to a 3.1% year-on-year increase. Among various mediums, the Internet saw the fastest growth at 12.1%. Television continues to dominate ad spend, with strong performances in North America and Asia-Pacific. Conversely, print media faces challenges, with magazines experiencing declines. The report highlights regional variations in ad spend growth, emphasizing differing paces across North America, Europe, and Latin America.

E N D
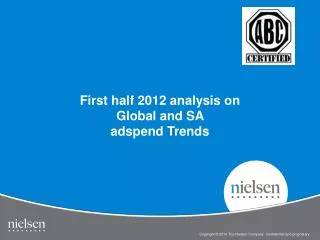
Global Advertising Trends insights from the Nielsen Global AdView Pulse Q1 2012
and so does ADVERTISING Source: Nielsen
Rising 3.1% YOY in Q1 ADVERTISING EXPENDITURE TREND million USD Source: Nielsen Global AdView Pulse Q1 2012 Based mainly on published rate cards
Internet the fastest growing medium… 12.1% 3.1% Internet Newspapers 7.9% Radio 2.8% Television 6.4% Outdoor -1.4% Magazines 4.1% …while magazines show a dip Cinema
But TV holds the biggest share of spend Q1 2012 Television Newspapers Magazines Cinema Radio Outdoor Internet
Growth proceeds on different paces North America Asia Pacific ME & Africa Latin America West Europe +1.7% +2.1% +9.6% +23.3% -1.4% Western Europe sees a dip when comparing Q1 2012 vs. Q1 2011, on the back of the Euro-zone crisis
Press still commands +30% share in Europe and Asia Pacific Media -- % Share of Spend -- Q1 2012 Television Newspapers Magazines Source: Nielsen Global AdView Pulse Q1 2012. Note: Internet share is based on a smaller subset of countries included in the report and should only be taken as an indication. Cinema Radio Outdoor Internet
North America increases marginally +4.0%growth for TV North America +2.1% -5.0%decline for magazines Canada -0.5 -3.6%decline for Healthcare US +2.2% +8.6%growth forFinancial Q1 2012 vs Q1 2011
Europe sees a dip in spending +12.1%growth for Internet Europe -1.4% -1.2%decline for Television UK Germany -1.8% +2.1% +4.8%growth for Cloth. & Acc. France +3.9% Italy -5.0%decline forFMCG -7.6% Spain -14.0% Q1 2012 vs Q1 2011
Asia Pacific shows a marginal increase +5.4%growth for Newspapers Asia Pacific China +1.7% -2.5% -0.6%small dip for Television Japan +5.5% +9.1%growth for Entertainment Australia -4.8% -0.7%small dip forAutomotive Q1 2012 vs Q1 2011
Latin America performs very well Mexico +7.5%growth for TV -6.1% +7.6%growth for Magazines in 2011 Brazil Latin America +13.3%growth for Automotive +14.9% +9.6% Argentina +28.5%growth for Telecoms +16.8% Q1 2012 vs Q1 2011
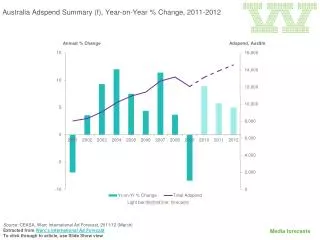
Total all Media with print splitZAR (Millions) ZAR (Millions) Excluding SP
Media Split Jan – Jun 2012 ZAR (Millions) % =Share of Voice
Top 10 Daily Newspapers (Jan – Jun ‘12) ZAR (Millions) Excluding SP
Top 10 Weekly Newspapers (Jan – Jun ‘12) ZAR (Millions) Excluding SP
Top 10 Magazines (Jan – Jun ‘12) ZAR (Millions) Excluding SP
Top 10 Advertisers in Magazines (Jan – Jun ‘12) ZAR (Millions) Excluding SP
Top 10 Advertisers in Newspapers (Jan – Jun ‘12) ZAR (Millions) Excluding SP
Thank You! Milton Tshabalala (011) 495 3124 Milton.tshabalala@nielsen.com