Download
1 / 40
420 likes | 751 Vues
Origin and History of Life. Macroevolutionary Patterns. Origin of Life - Chap 16. When and how did life appear on earth? What is life? Defining characteristics Issue of genotype and the phenotype What does the tree of life look like?

E N D
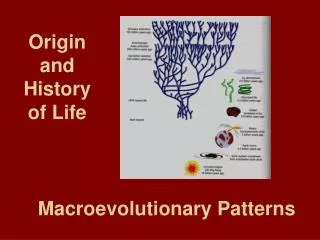
Origin and History of Life Macroevolutionary Patterns
Origin of Life - Chap 16 • When and how did life appear on earth? • What is life? Defining characteristics • Issue of genotype and the phenotype • What does the tree of life look like? • Problem of finding genes that can be compared between bacteria and humans
An RNA World • Problem: Living systems all have ability to store and transmit information (genotype=DNA) and express that information (phenotype=proteins) • either molecule can not do the other’s job • Discovery (1982) that RNA can act as a simple enzyme (ribozyme) suggests that it can have both a genotype and a phenotype
RNA Evolution • RNA evolution can be simulated in lab experiments (Beaudry and Joyce 1992) • Evolution of ribozymes with new or enhanced functions • Single molecule that transmits information, expresses a phenotype and can evolve - most likely as the “first” molecule among living organisms • Eventual transfer of information storage to DNA and use of proteins to express information • Unresolved issues: • Where did RNA come from? • Pre-biotic environment • No self-replicating RNA molecule has been identified
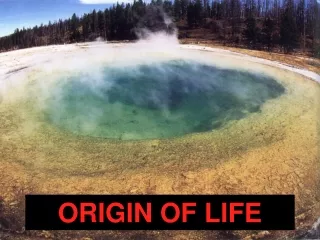
First Fossils of Living Organisms • Key innovation: development of cells • Allow compartmentalization of physiological reactions • Linkage of phenotypes produced by genotypes • Fossils of cyanobacteria (blue-green algae) from Western Australia (Schopf 1993 Science 260:640) • 3.46 billion ybp • Other chemical evidence (C isotope ratios) supports establishment of life by 3.8 billion ybp
Phylogeny of All Life • Difficulty: what gene shows recognizable similarity between all known organisms (bacteria and humans)? • Small unit ribosomal RNA (Woese 1977) • All organisms undergo translation and tertiary structure is similar • Construction of universal tree of life
Old Trees of Life “Two Kingdom” TOL “Five Kingdom” TOL
Inferences From the New Tree • Three Kingdoms: Bacteria, Archaea, Eucarya • Novel Results: • Close relationship between Eucarya (us) and poorly-know Archaea (extremophylic “bacteria”) • Tiny portion of evolutionary history made up by plants and animals
Phylogeny of all extant organisms based on rRNA sequences (Barnes et 1996 PNAS 93:9188) Major portions of tree remain unknown Major groups identified by sequences alone
Archaea particularly poorly known Expertise at OSU in Micro Dept
Importance of Lateral Gene Transfer In Evolution • Increasing evidence from for lateral gene transfer between major groups e.g. specific “bacterial” genes in Archaea • Single gene trees inaccurate • “Ancestor” may be a pool of organisms who readily traded genes Example: HMGCoA reductase gene in an Archaea groups with bacteria
Gene trees supporting Archaea and Bacteria as closest relatives Gene trees supporting Archaea and Eucarya as closest relatives Which genes reflect “true” relationships?
Common ancestor of all life (“cenancestor”) was community of species that traded genes with each other Main branches emerged but individual genes reflect patterns of ancestral gene transfer Open question: Is there a core of conserved genes that we can use to build an accurate Tree of Life?
Macroevolutionary Patterns - Chap 17 • Large-scale increases or decreases in diversity over long (myr) time periods • Largely inferred from fossil record • Biases in which taxa are preserved: pollen, hard tissues, shells but not soft tissues • Aquatic and marine species predominate • Systematics is based on morphology alone since no way of collecting genetic information
Patterns and Rates of Large-scale Species Change Through Time Gradualism Pattern in fossil record Punctuated Equilibirum
Explanations For Patterns of Change: Phyletic Gradualism (Darwin) • Rates of evolutionary change are constant • New species arise via gradual transformation of old species • Impression of “rapid” change is due to poor fossil record
Explanations For Patterns of Change: Punctuated Equilibrium (Gould and Eldridge) • Evolution occurs rapidly during a speciation event in a small isolated sub-population • Species remain static between speciation events • Rapid species-wide change is due to new species evolving in geographically isolated populations and then successfully reinvading ancestral species range
Gradualism and PE Make Claims About Both Patterns and Processes • Pattern: Relative frequency of gradual vs. punctuated patterns of change in fossil record • Processes: Evolutionary mechanisms responsible for change and stasis • Better information available for patterns than processes
Fossil Record Shows Good Examples of Both Punctuated and Gradual Patterns • Example of PE: Bryozoan fossils from Caribbean (Cheetham 1986) • Sessile marine invertebrates • Species defined on basis of 46 morphological characters • Validity for defining species confirmed with allozyme analysis of present-day species
Patterns of evolution in Bryozoans (Jackson and Cheetham 1994): -Rapid evolutionary change followed by stasis for long periods of time (myr) -Ancestral and descendant species co-exist
Example of Gradual Change: Welsh Trilobites (Sheldon 1987) • Species classified on basis of numbers of pygidial (hind) ribs • Change in rib number for eight genera documented over 3 myr.
Pattern of change: gradual change from ancestral to descendant form
PE or Gradualism? • Answer: Examples of both patterns are found in fossil record - no one pattern predominates (Erwin and Anstey 1995) • New issue: examples of PE found mainly in macrofossils (e.g. byrozoans) while gradualism found mainly in microfossils (e.g. formanifera) - why?
Evolutionary Mechanisms for Patterns of Change • Causes of rapid change for PE • Selection and/or drift in small isolated populations • Macromutations in key regulatory genes • Both not testable • Causes of Stasis: • Gradualists: stabilizing selection • PE: genetic constraint that prevents change (e.g. lack of genetic variation that would prevent species from responding to current selection pressures
Indirect Test of Genetic Constraint Idea • Comparison of genetic variation in “living fossils” vs. other groups • Horseshoe crabs vs other crustaceans (Avise et al 1994. Evol. 48:1986)
-Levels of genetic diversity in mtDNA 12sRNA are equivalent or higher in morphologically conserved horseshoe crabs as compared to more diverse Crustaceans -No evidence for a Lack of genetic Variation as a Constraint on morphological evolution
Extinctions • Ultimate fate of all species e.g. vertebrate species ~ 1-2 myr lifespan • Extant biodiversity: balance between extinction and speciation • Issues: • How does the interplay between extinction and speciation influence macroevolutionary patterns? • Mass extinctions
Factors Influencing Extinction Rates • Within biologically comparable groups of organisms extinction rates are independentof how long particular taxa have existed • Evidence from survivorship curves which are constant through time
Characteristics That Differ Between Taxa Can Influence Extinction/Speciation Rates • E.g. mode of development in marine snails • Planktonic development (PD): eggs released into ocean and larvae develop before settling • Direct development (DD): Young develop from eggs laid near adult • Mode of development can be inferred from fossil morphology PD DD
Tradeoff in Speciation and Extinction Rates Leads to Macroevolutionary Trend of Increased Numbers of DD Snails DD PD
Mass Extinctions • Periodic large-scale extinctions have occurred with loss of many species • Elevated extinction rates above background rates • Five events in which > 75% all species went extinct • Best studied: Late Cretaceous (KT) 65 myr bp
KT Extinction 65 myr BP • Synchronous, sudden extinctions of many groups e.g dinosaurs • Non-selective in terms of characteristics of organisms that survived
Why Did the KT Mass Extinction Occur? • Hypothesis: Effects due to impact of a huge asteroid hitting the earth (Alvarez et al. 1980) • Mechanism: Tidal wave, dust clouds that blocked sunlight, increased volcanism, acid rain had negative impact on life • Evidence: • Iridium (rare earth) deposits found at KT boundary that are characteristic of extraterrestrial object • Possible crater identified in Mexico • Other geological anomalies
Iridium (rare earth) deposits found at KT boundary that are characteristic of extraterrestrial objectMicrotektites and shocked quartz grains also found at KT boundaryIndicative of meteor impact
Extinctions Resulting from KT Impact • 60 - 80% all species became extinct at the KT boundary - selective or non-selective? Why? • Vertebrates: • Affected: dinosaurs, large marine reptiles (ichtyosaurs) • Not affected: mammals, amphibians • Other affected groups: Marine plankton, marine invertebrates • Spike in fern pollen deposits suggesting decline in forests
Best Supported Non-random Pattern of Extinction Extinction probability of genera of marine bivalves is correlated with geographic range and not latitude (tropical vs polar) , life form (burrowing vs. nonburrowing) or habitat (offshore vs inshore) (Jablonski and Raup 1995)