Download
1 / 24
240 likes | 355 Vues
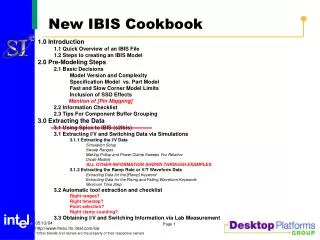
New Guidelines for Data Result Suppression of Small Cell Numbers in IBIS-Query Output. Public Health Informatics Brown Bag July 22, 2009 Kathryn Marti, Director Office of Public Health Assessment. Outline. Introduction Background Work Group Important Concepts Methodology The Guidelines

E N D
New Guidelines for Data Result Suppression of Small Cell Numbers in IBIS-Query Output Public Health Informatics Brown Bag July 22, 2009 Kathryn Marti, Director Office of Public Health Assessment
Outline • Introduction • Background • Work Group • Important Concepts • Methodology • The Guidelines • Next steps
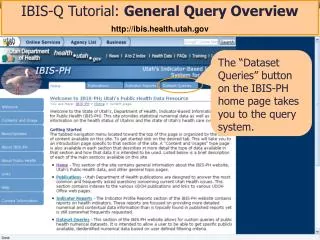
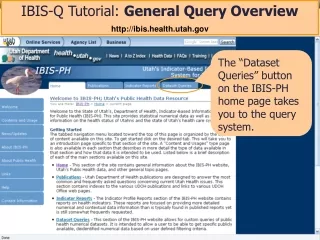
Introduction • Why not report data? • Protect privacy • Ensure reliable data • Why make data publicly available? • What reports? • Published reports • Online static tables • Web-based data query system output
Background • Current IBIS-Q suppression rules • Enhancements to IBIS-Q BRFSS • Increased likelihood of small cell sizes • Grew to department-wide effort • Develop UDOH-wide policy • HIPAA and more • Sensitivity for vulnerable populations
Data Suppression Decision Rules Work Group • Charter • Provide guidelines to UDOH programs • Program into IBIS-Q • Work Group Products: • Decision Rules • Decision Tree • Justification of the rules
Important Concepts • Confidence Interval • Coefficient of Variation • Power to detect a difference • Context/Use of the estimate
Coefficient of Variation CV=[100 x (SE(R)/R)]% • Where: • SE = the standard error of the estimate • R = the estimated rate • Unitless measure • Usually expressed as a percentage
Coefficient of Variation (cont’) • If the estimated percentage is greater than 50%, the CV is calculated by dividing the standard error of the estimate (SE(R)) by one minus the estimate (1-R). CV=[100 x (SE(R)/(1-R))]%
Coefficient of Variationfor Percentages Example #1 The crude estimated percentage of Utah adults aged 85 and older who were current cigarette smokers in 2007 was 7.65% with a standard error of 3.81%. CV = 100 x (0.0381/0.0765) = 49.8%
Coefficient of Variation for Percentages (cont’) Example #2 The crude estimated percentage of Utah adults aged 85 and older who were non-smokers in 2007 was 92.35% with a standard error of 3.81%. CV = 100 x (0.0381/(1-0.9235)) = 100 x (0.0381/0.0765) = 49.8%
Coefficient of Variation for Count Data D = # of deaths ~ Poisson P = # in population where deaths occurred R = rate per 100,000 = (D/P) *100,000 Var(R) = Var [(D/P) x 100,000] = (100,000/P)2 Var(D) = (100,000/P) x ((100,000*D)/P) = (100,000/P) x R CV = 100 x [SQRT(Var(R))]/R = 100 x [SQRT((100,000/P)*R)]/R = 100 x SQRT[100,000/(P*R)]
Coefficient of Variation for Count Data (cont’) Example #1 D = 388 Alzheimer’s disease deaths in Utah in 2006 P = UT Population in 2006 was 2,615,129 R = (388/2,615,129) x 100,000 = 14.84 per 100,000 CV = 100 x SQRT[100,000/(P*R)] CV = 100 x SQRT[100,000/(2,615,129 x 14.84)] = 5.08%
Coefficient of Variation for Count Data (cont’) Example #2 D = 5 Alzheimer’s disease deaths in Utah adults between the ages 55-64 in 2006 P = 55-64 UT Population in 2006 was 201,340 R = (5/201,340) x 100,000 = 2.48 per 100,000 CV = 100 x SQRT[100,000/(P*R)] CV = 100 x SQRT[100,000/(201,340 x 2.48)] = 44.75%
Methodology • Literature review • Compared suppression rules using BRFSS small area, low prevalence data. • < 5 observations in numerator or 30 in denominator • CV greater than 30% • CV greater than 50% • the CI length larger than the estimated percent • 1/2 the CI length >10% and denominator less than 50
Guidelines Minimum Criteria For Reporting Both Survey Data and Population Event Data: • ü CV < 50% • ü If 30% < CV < 50% an asterisk should be included with a footnote that says: *Use caution in interpreting, the estimate has a relative standard error greater than 30% and does not meet UDOH standards for reliability.
Guidelines Strict Criteria For Reporting Survey Data: • ü> 10 cases in the numerator • ü AND a CV < 30% For Reporting Population Event Data: • ü> 20 cases in the numerator and >100 persons in the population • AND a CV < 30%
<30% REPORT <50% CV=SE/RATE REPORT WITH WARNING 30<CV<50% SUPPRESS OR AGGREGATE GENERAL (MINIMUM CRITERIA) >50% RATE <30% REPORT REPORT WITH WARNING >50% CV=SE/(1-RATE) 30<CV<50% KIND OF POPULATION SURVEY DATA SUPPRESS OR AGGREGATE >50% REPORT <30% <50% CV=SE/RATE TYPE OF DATA SUPPRESS OR AGGREGATE >30% VULNERABLE (STRICT CRITERIA) ≥10 RATE COUNT DATA <30% REPORT NUMERATOR >50% CV=SE/(1-RATE) SUPPRESS OR AGGREGATE >30% SUPPRESS OR AGGREGATE <10
CV=100 x 100,000 . PR CV= 100 x 100,000 . PR ) ) √( √( <30% REPORT SURVEY DATA REPORT WITH WARNING GENERAL (MINIMUM CRITERIA) 30<CV<50% TYPE OF DATA SUPPRESS OR AGGREGATE >50% KIND OF POPULATION COUNT DATA <30% REPORT ≥20/100 VULNERABLE (STRICT CRITERIA) SUPPRESS OR AGGREGATE >30% CELL SIZE SUPPRESS OR AGGREGATE <20/100
Next Steps • Program into IBIS-Q and SAS CGI • Determine how to display output and notes • New Mexico example • Utah Test server • Get OK from Data Stewards • Minimum criteria vs. Strict criteria
Next Steps (con’t) Suggested text for 30% < CV < 50% : • *Use caution in interpreting, the estimate has a relative standard error greater than 30% and does not meet UDOH standards for reliability.