Working Capital Management
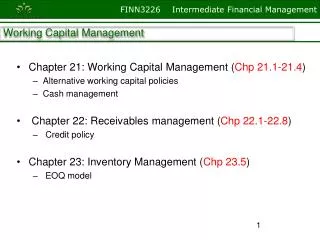
Working Capital Management. Chapter 21 : Working Capital Management ( Chp 21.1-21.4 ) Alternative working capital policies Cash management Chapter 22: Receivables management ( Chp 22.1-22.8 ) Credit policy Chapter 23: Inventory Management ( Chp 23.5 ) EOQ model.

Working Capital Management
E N D
Presentation Transcript
Working Capital Management • Chapter 21: Working Capital Management (Chp21.1-21.4) • Alternative working capital policies • Cash management • Chapter 22: Receivables management (Chp 22.1-22.8) • Credit policy • Chapter 23: Inventory Management (Chp 23.5) • EOQ model
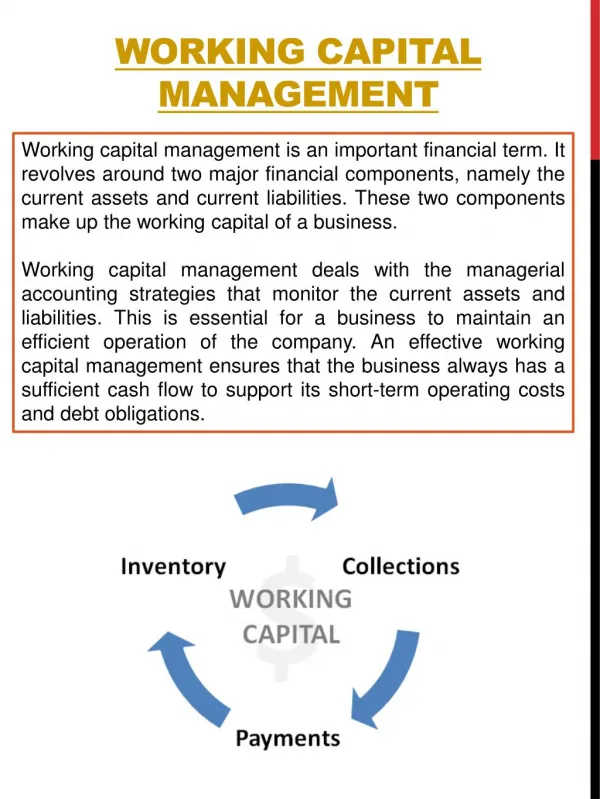
Chapter 21: Basic Definitions • Gross working capital: Total current assets. • Net working capital: Current assets - Current liabilities. • Net operating working capital (NOWC): Operating CA – Operating CL = (Cash + Inv. + A/R) – (Accruals + A/P) (More…)
Working Capital Management • Working capital management: Includes both establishing working capital policy and then the day-to-day control of cash, inventories, receivables, accruals, and accounts payable. • Working capital policy: • The level of each current asset. • How current assets are financed.
Cash Conversion Cycle (CCC) The cash conversion cyclefocuses on the time between payments made for materials and labor and payments received from sales:
Cash Conversion = Cycle (CCC) Inventory Conversion + Period Receivables Collection − Period Payables Deferral Period Cash Conversion Cycle (CCC) • CCC components • Production cycle – from when product is started until customer “buys” the product • Collection cycle – from time customer “buys” the product until customer makes payment • Payment cycle – from the time company receives materials for production until the company makes payment to supplier
Cash Conversion Cycle (CCC) • Estimating production cycle • Find average inventory • Determine inventory turnover using COGS • Calculate production cycle • Estimate collection cycle • Find average accounts receivable • Determine A/R turnover using credit sales • Calculate collection cycle
Cash Conversion Cycle (CCC) • Estimate payment cycle • Find average accounts payable • Determine accounts payable turnover • Calculate payment cycle
Example CCC = Inventory Conversion Period + Average Collection Period – Payable Deferral Period Inventory COGS per day Days per year Inv. turnover Inventory Conversion Period = = $140 $1013.9/365 = = 50.4 days
Example CCC = Inventory Conversion Period + Average Collection Period – Payable Deferral Period Receivables Sales/365 Days Sales Outstanding Average Collection Period (ACP) = ( ) $445 $1216.7/365 = = 133.5 days
Example CCC = Inventory Conversion Period + Average Collection Period – Payable Deferral Period Payables Purchases per day Payables COGS/365 Payable Deferral Period = = $115.0 $1013.9/365 = = 41.4 days CCC= 50.4+133.5-41.4= 142.5 days
Cash Management Cash Management: Cash doesn’t earn interest, so why hold it? • Transactions: Must have some cash to pay current bills. • Precaution: “Safety stock.” But lessened by credit line and marketable securities. • Compensating balances: For loans and/or services provided. • Speculation: To take advantage of bargains, to take discounts, and so on. Reduced by credit line, marketable securities.
What’s the goal of cash management? • To have sufficient cash on hand to meet the needs listed on the previous slide. • However, since cash is a non-earning asset, to have not one dollar more.
Cash Budget: The Primary Cash Management Tool • Purpose: Uses forecasts of cash inflows, outflows, and ending cash balances to predict loan needs and funds available for temporary investment. • Timing: Daily, weekly, or monthly, depending upon budget’s purpose. Monthly for annual planning, daily for actual cash management.
Data Required for Cash Budget • Sales forecast. • Information on collections delay. • Forecast of purchases and payment terms. • Forecast of cash expenses: wages, taxes, utilities, and so on. • Initial cash on hand. • Target cash balance.
Cash Budget • Should depreciation be explicitly included in the cash budget? • No. Depreciation is a noncash charge. Only cash payments and receipts appear on cash budget. • However, depreciation does affect taxes, which do appear in the cash budget. • What are some other potential cash inflows besides collections? • Proceeds from fixed asset sales. • Proceeds from stock and bond sales. • Interest earned. • Court settlements.
Cash Budget • How can interest earned or paid on short-term securities or loans be incorporated in the cash budget? • Interest earned: Add line in the collections section. • Interest paid: Add line in the payments section. • Note: Interest on any other debt would need to be incorporated as well. • How could bad debts be worked into the cash budget? • Collections would be reduced by the amount of bad debt losses. • For example, if the firm had 3% bad debt losses, collections would total only 97% of sales. • Lower collections would lead to lower surpluses and higher borrowing requirements.
Chapter 22: Elements of Credit Policy • Credit Standards: Tighter standards reduce bad debt losses, but may reduce sales. Fewer bad debts reduces DSO. • Cash Discounts: Lowers price. Attracts new customers and reduces DSO. • Credit Period: How long to pay? Shorter period reduces DSO and average A/R, but it may discourage sales. • Credit term includes both cash discount and credit period. • Example of credit terms: 1/10, net 30 or 2/10, net 40 • Collection Policy: Tougher policy will reduce DSO, but may damage customer relationships. Example: • 50% pay on Day 10 • 40% pay on Day 30 • 10% pay on Day 40 What’s DSO? 50%*10+40%*30+10%*40=21 Total discounts if sales are $400 Million: 400,000,000*50%*1%=2,000,000
Current Credit Policy • Current credit policy: • Credit terms = 1/10, net 30 • Gross sales = $400 million • Collection: 50% pay on Day 10, 40% pay on Day 30,10% pay on Day 40 • Bad debt losses = 2.5% of gross sales. • Variable cost (Operating cost) ratio = 70%. • Cost of funds= 20%. • Then cost of carrying receivable=DSO*(Sales per day)*(variable cost ratio)*(cost of funds)=21*(400,000,000/365)*70%*20%=$3.22 million ~=3 million
New Credit Policy • New credit policy: • Credit terms = 2/10, net 40 • Gross sales = $530 million • 60% (of paying customers) pay on Day 10, 20% pay on Day 40, 20% pay on Day 50. • Bad debt losses = 6% of gross sales. • Variable cost (Operating cost) ratio = 70%. • Cost of funds= 20%. • New DSO=60%*10+20%*40+20%*50=24 • Cost of carrying receivable=24*(530m/365)*70%*20%= $4.878~=5 million • Bad debt loss=0.06*530m=31.8~=32m, reduce collection expense to 2m (given)
Method 2: Incremental Analysis • Changing from cash-only policy to offering 30-day credit
Incremental Investment on Receivables • In this sample, the change in policy will increase sales– both from the additional purchase from old customers and purchases from new customers • The first term, the increased investment in accounts receivable associated with old sales, is based on the full amount of the receivables, • The second term, the investment associated with incremental sales, consists of incremental receivables multiplied by V, the variable cost percentage.
Incremental Profits • Given ΔI, we can use Equation 22-3 to determine the incremental profit, ΔP, associated with the proposed credit period change
Chapter 23: Inventory Management Why is inventory management vital to the financial health of most firms? • Insufficient inventories can lead to lost sales. • Excess inventories means higher costs than necessary. • Large inventories, but wrong items leads to both high costs and lost sales. • Inventory management is more closely related to operations than to finance.
Assumptions of the EOQ Model • All values are known with certainty and constant over time. • Inventory usage is uniform over time. • Carrying costs change proportionally with changes in inventory levels. • All ordering costs are fixed. • These assumptions do not hold in the “real world,” so safety stocks are held.
Total Inventory Costs (TIC) • TIC = Total carrying costs+ total ordering costs • TIC = CP(Q/2) + F(S/Q). • C = Annual carrying costs (% of inv.). • P = Purchase price per unit. • Q = Number of units per order. • F = Fixed costs per order. • S = Annual usage in units.
d(TIC) dQ CP 2 FS Q2 = - = 0 Q2 = EOQ = Q* = 2FS CP 2FS CP Inventory Management Derive the EOQ (Economic Order Quantity) model from the total cost equation
$ TIC Carrying Cost Ordering Cost 0 EOQ Units Average inventory = EOQ/2. Inventory Model Graph
P = $200; F = $1,000. S = 5,000; C = 0.2; Minimum order size = 250. 2($1,000)(5,000) 0.2($200) EOQ = = = 250,000 = 500 units. $10,000,000 40 Assume the following data:
TIC = CP(Q/2) + F(S/Q) = (0.2)($200)(500/2) +$1,000(5,000/500) = $40(250) + $1,000(10) = $10,000 + $10,000 = $20,000. Inventory Management What are total inventory costs when the EOQ is ordered?