Download
1 / 30
300 likes | 484 Vues
Sustainable urban transport strategies and job creation. Christophe Heyndrickx (TML) Rodric Frederix (TML) Joko Purwanto (TML). Overview. Empirical facts on urbanization Basic urban economic theory Urban policies Results from case studies Job creation effects Conclusion. Why the city?.

E N D
Sustainable urban transport strategies and job creation Christophe Heyndrickx (TML) Rodric Frederix (TML) Joko Purwanto (TML)
Overview • Empirical facts on urbanization • Basic urban economic theory • Urban policies • Results from case studies • Job creation effects • Conclusion
Why the city? Source: World Urbanization Prospects (2012) The world is becoming more and more urban. By 2050 – 85.9 % of the population in the developed world and 64.1% of the developing countries will live in an ‘urbanized’ environment Socio-economic transition = larger and denser urban regions with intensive use of transport networks
What is the city - theory • Benefits of agglomeration of activities CITIES = + Positive returns to scale (scale economies) + Specialization + Spill-over effects between economic activities + Reduction of transport costs in firm-firm, worker-firm and consumer-firm interactions
SPECIALIZATION SCALE ECONOMIES 1 large firm with 100 employees Produces more than 100 firms with 1 employee Large cities = higher diversity of activities – labour is more productive than in smaller cities (access to different skills – input/output markets)
SPILLOVER between economic activities Take example of the mall. People start with idea of buying shoes, but end-up going to the clothes and toy stores. => Positive external impact on profits ‘Natural’ advantage of central location to reduce transport costs As old as the Central Place Theory of Christaller (1933)
The ‘workhorse’ model – The Alonso-Mills-Muth model (1964-1966) • There is a central business district where all ‘jobs’ in the city are located • Every employee gets the same wage, y • Total transport costs increase linearly when moving away from the center with TC = t. x • Every consumer uses either housing or a ‘numeraire good’ let’s assume this is food (bread). • Food costs the same anywhere, but housing varies in cost. • The location of consumers is IN EQUILIBRIUM, which means that everybody choses a location where people are equally well off (GET SAME UTILITY) • There are no moving costs!
Understanding the equilibrium Consumption of food Utility curve Consumption of housing
What do we take from this? • Intricate link between the transport system, housing, land prices and the system of urban settlements • Urban systems with very low transport costs -> spread out remarkably far from center and low population density • Link between highways and rise of suburban settlement (Baum-Snow N., 2007) • If cost of transport is too low (unpriced externalities) cities are too big and lower efficiency of land use. • Pricing externalities (congestion, environmental damages, accident costs, etc.) also leads (on longer term) to smaller cities with a better functioning transport system • Introducing a system of road charging, f. ex. Small & Verhoef (2007) or Anas A. et al (2006) leads to denser cities and the social optimum. However no single country has introduced a ‘universal road charging’ system
Urban policy • Case of London, Milan and Copenhagen • Not-unique, but indicatory for ‘sustainable’ urban policy • Comparable strategies – divergent ‘historical track record’ • Economic centers • Particular problems for particular location – strategies to mitigate • Plenty of information available • Well-known examples for ‘innovative’ transport policy • Strategies: • Milan: Pricing – LEZ – Investments in public transport • Londen: Pricing – Technology – Investments in public transport • Copenhagen: Urban planning – Cycling (1/3) / Road (1/3) / Public (1/3)
Main policies Urban planning • Implementation of a ‘controlled’ urban extension plan (Copenhagen) in a very early stage of planning, did not stop urban sprawl, but directed it towards certain well connected regions. • Limitations: ‘Ørestad’ extension as the 6th finger (Majoor S.J.H, 2008)-Lower demand for land (-15%) & -Property tax income (-60%) -Higher cost (+66%)-Conflicts between authorities -Additional financing-Switch from ‘out-of-center’ office space to housing.
Road charging / LEZ • Not many cities have implemented a road charging system in the way it is theoretically intended, namely: ‘a kilometre and time-dependent road charge to optimise the use of the capacity and reduce external congestion costs. • In the cities where road charging or a similar type of charges were introduced (London, Milan, Stockholm), public acceptance grew substantially after introduction. • The impact of a road charge is largest when the charge is first introduced (-20 % / -30% in traffic) • The impact on longer term is often lower, as people tend the change their travel behaviour and/or location or exploit certain exemptions built into the scheme. • In fact, this makes clear that road charging is only one of the tools a city can use to improve the urban traffic flow and that its set-up should be considered carefully.
London (LCCS) • Only small area of the city • Large discounts to residents of the central area (-90%) and other exemptions • Little difference in timing, location and trip distance (not kilometre dependent) • High operational cost and implementation costs (£200 million) • The limited area it extends to (central city alone) -> Introduction (weakening of congestion charge) to a LEZ for Greater London EcoPass / Area C (Milan) • Ecopass = charge for ‘polluting’ vehicles in the center of Milan since 2010 • Short term: reduction in PM with -20% and traffic with 21% • After 2 years: traffic levels return to pre-introduction phase (older vehicles out-of-stock) • Area C: introduced in 2012 as sequel for EcoPass. • €5 for each vehicle entering the zone + 40 free entrances for residents
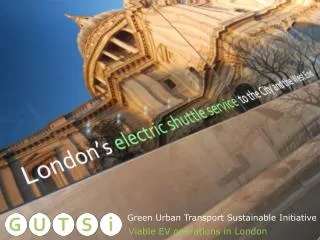
Public transport • Each of the cities discussed relies heavily on subway, tram and bus networks to move passengers across the city. • Improvements in ticketing, such as standard tickets across all intra-city transport and ‘fast-passes’ such the Oyster pass, can reduce waiting times substantially and make public transport more attractive. • Earmarking the taxes from the road charge, has substantially helped to gain public acceptance for the scheme. • This creates a direct link between the revenues collected from road charges (and thus from congestion) and investments in public roads and public transport. Promotion of fuel efficient vehicles • Free parking & free recharging for electric vehicles / hybrids • Tax discounts / subsidies on national level Promotion of cycling & walking • Milan – bike sharing program – only very limited cycling (<1%) • London – promotion of cycling – reaching 1% of trips • Copenhagen – reaching 33% of total trips
Job creation effects • Main idea: combine the ‘micro’ and ‘macro’ effects of urban policy • What happens for small moves towards ‘sustainability’, can we determine the ‘extra’ jobs that are created? • Combination of literature review and model based analysis • Run the EDIP model of D15.2 with a small shock in subsidies / investments or increase in efficiency • Calculate the small amount of additional employment this generates
Impacts of urban policy • Compare different policies with each other on the basis of the theory, literature review, case-study and modelling • Implicit link with the global scenarios of D15.2 • Energy efficiency = strongest policy in terms of combining job creation effects & sustainability • Fuel efficiency / electrification: negative impact on congestion • Transport policies: promoting cycling is probably the policy with the lowest cost and the highest impact • Parking policy can be second-best for a road charging system, technological progress allows for: • Dynamic pricing according to hour of arrival and departure • Different charges for fuel-efficient or electric vehicles
Conclusions • Very diverse work – combination of different methods • Link between global scenarios and the micro-scenarios -> socio-ecological transition will be strongest at the level of the city • Road charging / road tolling very powerful policy to redirect traffic flows, but politically difficult to defend • Second-best parking policy may be used as a proxy • Effectiveness of cycling policy • Urban planning effective for long term city planning, when driven by ‘demand’ • Restrictions for urban freight / urban delivery center have questionable results