Download
1 / 36
360 likes | 532 Vues
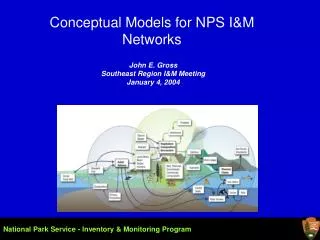
Conceptual Models for NPS I&M Networks. John E. Gross Southeast Region I&M Meeting January 4, 2004. National Park Service - Inventory & Monitoring Program. Two views of conceptual models:. central element of monitoring plan and program

E N D
Conceptual Models for NPS I&M Networks John E. Gross Southeast Region I&M Meeting January 4, 2004 National Park Service - Inventory & Monitoring Program
Two views of conceptual models: • central element of monitoring plan and program • useful for organizing and communicating complex system dynamics • improved understanding • great for justifying vital signs (will be good for interpretation) • a real struggle – another WASO requirement • largely a waste of time • “our oversight committees hate them” • a duplication of the obvious
Roadmap • Goals and observations from networks • Examples, alternative models, etc • Recommendations • Resources
Goals for conceptual models in the monitoring plan • Formalize current understanding of system dynamics, • Explicitly connect key processes to system dynamics, • Identify linkages of processes, esp. across disciplinary boundaries, • Communicate important interactions and feedbacks, • Illustrate linkages between important processes and vital signs.
Refer to the monitoring plan checklist (download from I&M web site)
What is a conceptual model, really? • table of “relationships”? • picture of system? • box and arrow diagram? • narrative?
In the end, most network monitoring plans include • box and arrow diagrams (one sort or another) • eventually, both control and “driver-stressor” models • tables with important drivers, responses • narratives describing models Models are expressions of hypotheses. Most models need periodic revision.
A few observations … • Many model formulations are useful • no single model type meets all needs • “All models are wrong, but some are useful” • Networks use multiple model structures because it’s easier & faster to construct need-specific models, • Hierarchically structured sets of models have advantages • can “begin at the beginning”, • systematic means to added detail over time, • coherent set of models with obvious linkages, • Craft is important – it takes time to design diagrams.
Hierarchical sets of models Model Scale What it communicates Generalized environmental model Stage-setting; global and regional scale drivers and responses Landscape-scale diagrams Environmental gradients; broad-scale drivers; linkages between systems (disturbance, land use) Ecosystem Dynamics; broad to fine scale factors Species, site, or habitat models Detailed mechanisms & feedbacks, stressors->VS
A pragmatic approach to developing useful conceptual models • First steps • Define the objectives for the models • Who are the audiences and what are purposes? • What “distinct” systems were identified by ecologists and managers? • What important dynamics do you want to accommodate? • Are there key linkages between systems (i.e., higher-level needs)?
A pragmatic approach to developing useful conceptual models • First steps • Define the objectives for the models • Create or adopt a high-level model to: • Provide overarching context • Shared reality of system • Prevent oversight
Constructing models • What works (mostly …) • well-organized workshop w/ NPS staff, topical experts, modeler • collaborative projects with intermediate milestones • 2 or 3 ecologists working together • a network ecologist in their area of expertise • What doesn’t work (almost always) • a “creative” workshop w/o experienced people in each group • independent contracts • one-size fits all approach (i.e., uniform model structure) • network staff attempting to create all models themselves
Some examples • Descriptive ecosystem diagrams • High-level, aggregated “holistic” models • State and transition models • ‘Control’, mechanistic models • Conceptual diagrams • Aggregate, box-and-arrow diagrams (hybrid)
Descriptive diagrams – good for ‘setting the scene’ (IAN Newsletter 5: www.ian.umces.edu) (Mutel and Emerick 1992) (Knight 1994)
Generalized models GLOBAL CLIMATE Regional atmospheric resources & conditions Disturbance regime TIME TOPOGRAPHY Ecosystem Processes Soil / water resources & conditions Functional groups PARENT MATERIAL POTENTIAL BIOTA (Chapin et al. 1996)
Next, develop models for important ecosystems or subsystems Systems are place-based! This is how most of us think about the world. • System dynamics may determine model structure • state and transition models • arid, semi-arid systems • some aquatic systems • control model • causal loop, process, mechanistic model • picture model • EPA-type stressor model
Moderately dense even or mixed-aged stand • many saplings • infrequent fire due to suppression or non-continuous ground fuel • fires likely to be intense, extensive, and stand-replacing • Desirable park-like stand • grassy understory • ~ 100 trees/ac • frequent “cool” ground fires • fires extensive and patchy • minimal influence by exotics Overgrazing, fire suppression Prescribed burning, thinning Intense crown fires Thin and burn? • Dense even-aged stand • stand-replacing fires frequent or infrequent • understory vegetation sparse • fuel load large and continuous • fires intense and spatially extensive Ponderosa pine state and transition model
Fuel load: trees & grass biomass, weather This model is structurally correct Seed production / persistence (pollination, granivory, decay, etc) Seed bank Seedlings (#/ha) Saplings (#/ha) Snags (#/ha) Trees (#ha) Survival and growth Survival rate Survival and growth Decay, combustion Fire extent Fire intensity Grazing, thinning Fuel continuity(stand) Fuel continuity(landscape) Fire submodel Fire frequency: (suppression, prescribed burning, lightning) Ponderosa pine control model
Laramie Foothills Conceptual Model for Ponderosa Pine System Ponderosa Pine Fairly open with grass understory Low risk Historical 30-40% Current-5-12% Openings Low Risk Historical-25-35% Current-2-5% Fire maintains this state Fire maintains this state Persistent Old Growth forest Low risk Historical -10-20% Current-1-3% Mixed Conifer closed canopy with under story of Pipos seedlings, juniper, doug fir, aspen, shrub species. High Risk Historical - 15-25% Current- 80-95% Fire partially maintains this state Growth: Fire: Recruitment: TNC Ecosystem model
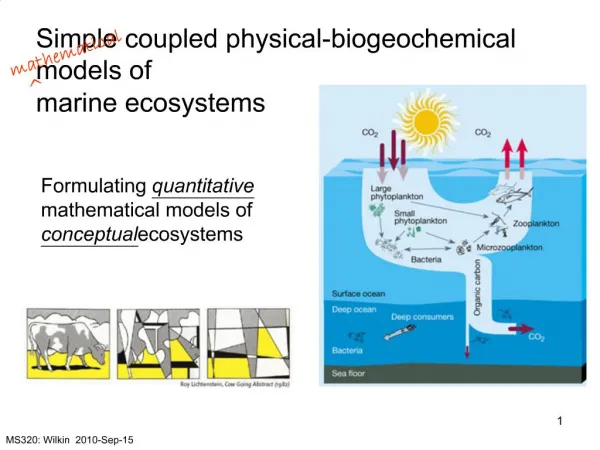
A conceptual model of the Bremer River ecosystem has been developed that is suitable for (1) developing a coherent overview of relevant ecological and biogeochemical processes affecting water quality and also for (2) design of a relevant survey sampling program and (3) subsequent design of a numerical simulation model to test water quality improvement strategies. Figure 1: Primary water column nutrient cycles in Bremer River and inputs of phosphates, silicates, DOC, DON and inorganic nitrogen. From: http://www.coastal.crc.org.au/bremer/ecosystem_dynamics.html
From: http://www.coastal.crc.org.au/bremer/ecosystem_dynamics.html
Model strengths and weaknesses • Control models • accurately represent feedbacks and interactions • usually most realistic structure • insights from construction • often complicated and hard to communicate • state dynamics may not be apparent • State and transition • clear representation of alternative states • can be simple • excellent communication with most audiences • generally lack mechanism • usually too general to directly link to vital signs • Driver-stressor models • provide clear link between agent of change and VS • simple and easy to communicate • no feedbacks • few or no mechanisms • frequently inaccurate and incomplete
A bit on the craft …it does make a difference!!! • align boxes, both horizontally and vertically • use line weights to show significance of linkage • avoid shaded boxes that photocopy poorly • use few colors and shapes • aggregate lines when possible • maximize ‘content ink’
Common-Language Indicators EMAP Indicator names for forests Contamination of Forest Plants by Air Pollution Lichen chemistry Foliar chemistry Dendrochemistry Bioindicator plants - ozone Crown condition Lichen communities Photosyntheticaly active radiation - leaf area Root ecology Health of Forest Plants Branch evaluations Visible plant damage Regeneration Mortality Soil classification & physiochemistry Woodland Productivity for Forest Products Tree growth Overstory diversity Vegetation structure Dendrochronology Forest structure scenic rating Forest Aesthetics Habitat Quality for Birds and Deer Wildlife habitat Craft matters – help readers by grouping related elements, aligning elements, and minimizing crossed lines. Schiller et al. 2001. Cons. Ecol 5(1)19. These are the same!
Lithosphere Hydrosphere Biosphere Atmosphere Cryosphere Intensive land use Extensive land use Disturbance regime Global change Values: Wilderness Viewshed Night sky Soundscape Ecosystem condition Changes in effective reserve size Ecological flows Ecosystem resilience Crucial habitat Edge effects Some aspects may be non-spatial Craft matters! Lithosphere Hydrosphere Biosphere Atmosphere Cryosphere Global change Intensive land use Extensive land use Disturbance regime Ecosystem condition Values: Wilderness Viewshed Night sky Soundscape Changes in effective reserve size Ecological flows Ecosystem resilience Crucial habitat Edge effects Some aspects may be non-spatial
What would the ideal conceptual modeling workshop include? • good background material, mailed to participants 3 weeks prior • I&M program, model goals, example models, workshop goals • glossary of terms & table of contents • park info: mgmt issues, natural resources (table if multiple parks) • information organized by working group (aquatic, etc.) • managers, ecologists, “drawers” in each group (3-6 people/group) • LCD projector and white board for each breakout group • form to describe each model: • system it represents • key features / interactions • mgmt levers • indicators and justification • information sources (citations, people, web sites, etc)
What does the ideal monitoring plan Chapter 2 include? • Introduction / background. Very short justification / goals • Organized table listing all models, with figure and page numbers • Overall description of models – more aggregated, scales, etc. • Clear diagrams and tables • Explanatory narrative that matches and refers to figures • Pertinent citations, all in the bibliography • and, of course, models that meet all the criteria in the checklist
Resources for model builders – Borrow where you can!!: I&M Conceptual modeling web page: www.nature.science.nps.gov/im/monitor/conceptual_models.htm Integration and Application (IAN) http://www.ian.umces.edu Maddox et al. 1999 – best single paper Pugent Sound Conceptual Models Gulf of Alaska Ecosystem Monitoring (GEM) Westernport Bay Conceptual Model document (Oct. 2003) River models (Australia) http://www.healthywaterways.org/ USDA NRCS state and transition models (Brandon Bestelmeyer) Bremer R. model: http://www.coastal.crc.org.au/bremer/ecosystem_dynamics.html