
Uploaded by
paley
16 SLIDES
253 VUES
160LIKES
Cluster Analysis of Tumor Gene Expression Data at 25 Weeks
DESCRIPTION
Analyze gene expression data for tumor samples at 25 weeks using hierarchical and k-means clustering to identify profiles differing between WT and KO tumors. Select 389 key genes for analysis.
Download
1 / 16
Télécharger la présentation 
Cluster Analysis of Tumor Gene Expression Data at 25 Weeks
An Image/Link below is provided (as is) to download presentation
Download Policy: Content on the Website is provided to you AS IS for your information and personal use and may not be sold / licensed / shared on other websites without getting consent from its author.
Content is provided to you AS IS for your information and personal use only.
Download presentation by click this link.
While downloading, if for some reason you are not able to download a presentation, the publisher may have deleted the file from their server.
During download, if you can't get a presentation, the file might be deleted by the publisher.
E N D
Presentation Transcript
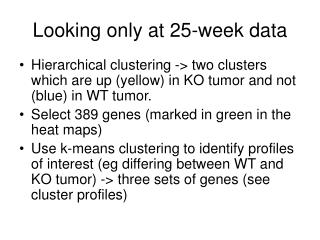
Looking only at 25-week data • Hierarchical clustering -> two clusters which are up (yellow) in KO tumor and not (blue) in WT tumor. • Select 389 genes (marked in green in the heat maps) • Use k-means clustering to identify profiles of interest (eg differing between WT and KO tumor) -> three sets of genes (see cluster profiles)
Arrangement for k-means clustering WT KO T Uninv MCA T T Uninv MCA


More Related
Audio
Live Player