Download
1 / 6
60 likes | 164 Vues
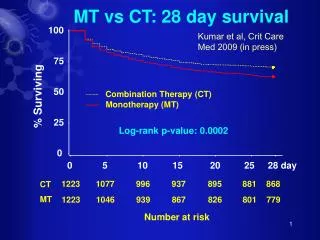
This study compares the efficacy of Combination Therapy (CT) versus Monotherapy (MT) in improving survival rates. Results show significant benefits of CT over MT, with key data points analyzed at various time intervals. The research also evaluates Hazard Ratios for primary and secondary antibiotics on different organisms and clinical syndromes.

E N D
MT vs CT: 28 day survival 100 Kumar et al, Crit Care Med 2009 (in press) 75 50 Combination Therapy (CT) % Surviving Monotherapy (MT) 25 Log-rank p-value: 0.0002 0 0 5 10 15 20 25 28 day 1223 1077 996 937 895 881 868 CT MT 1223 1046 939 867 826 801 779 Number at risk
MT vs CT: 28 day pressor liberation 100 Kumar et al, Crit Care Med 2010;38:1773–85 80 Combination Therapy (CT) 60 Monotherapy (MT) Pressor dependence (%) 40 Log rank p-value = 0.03 20 0 0 5 10 15 20 25 28 Time (days) MT 1223 319 108 47 21 16 15 CT 12 1223 300 90 43 18 12 Number at risk
n p value b -lactams 1858 .0002 penicillins 791 .05 penicillin/ampicillin 133 .19 anti-staph penicillin 76 .13 b -lactam/inhibitor 582 .28 cephalosporins 1060 .0007 1st gen ceph 39 .049 2nd gen ceph 122 .01 non-Ps 3rd gen ceph 671 .02 anti-Ps 3rd/4th gen ceph 235 .54 carbapenem 306 .77 vancomycin 158 .66 fluoroquinolone 110 .79 macrolide/clindamycin 12 .30 0.01 0.1 1 10 Hazard Ratio Combination vs Monotherapy: Primary Antibiotic Kumar et al, Crit Care Med 2010;38:1773–85
n p value 94 .56 GAS 63 .16 non-GAS strep 60 .68 viridans strep 282 .01 S. pneumoniae 267 .10 S. aureus 59 .30 Enterococcus sp all gram + 829 .008 759 .14 E. coli 283 .25 Klebsiella sp 106 .36 Enterobacter sp 138 .69 other enterobacteriaciae all enterobacteriaciae 1286 .04 200 .27 Ps. aeruginosa 63 .30 Hemophilus sp 47 .74 other non-enterobacteriaciae all non-enterobacteriaciae 310 .12 all gram - 1617 .009 0.1 1 10 Hazard Ratio Combination vs Monotherapy: Organisms Kumar et al, Crit Care Med 2010;38:1773–85
n p value b -lactams (n=930) 1289 .04 AG 1349 .002 FQ 1072 .01 ML/CL 938 .51 other Vancomycin (n=82) 145 .78 AG 89 .69 FQ 87 .98 ML/CL 90 .43 other Fluoroquinolones (n=50) 91 .38 AG 62 .65 ML/CL All primary drugs (n=1223) 1749 .046 AG 1781 .0009 FQ 1403 .006 ML/CL 0.1 1 10 Hazard Ratio Combination vs Monotherapy: Secondary Antibiotic Kumar et al, Crit Care Med 2010;38:1773–85
n p value Primary BSI 138 .62 102 CRI .45 888 .003 RTI 453 UTI .15 547 IAI .42 25 CNSI .20 SSTI 235 .25 32 SSI .07 ITI (non-resp) 15 .64 all non-resp inf 1558 .02 966 .04 SC+ inf SC- inf 1480 .0009 1249 .003 bacteremic inf 1197 .02 non-bacteremicinf 0.01 0.1 1 10 Hazard Ratio Combination vs Monotherapy: Clinical Syndrome Kumar et al, Crit Care Med 2010;38:1773–85