The Best Inventory Spreadsheet Ever
How to Match the System to Your Business Data. What factors need to be considered?Service level desiredLead timeSafety stock levelsDemand dataLot sizeCycle stockSpreadsheet can be developed for raw materials, WIP, and finished goods. Service Level. Management should define thisStatistically

The Best Inventory Spreadsheet Ever
E N D
Presentation Transcript
1. The Best Inventory Spreadsheet Ever
2. How to Match the System to Your Business Data What factors need to be considered?
Service level desired
Lead time
Safety stock levels
Demand data
Lot size
Cycle stock
Spreadsheet can be developed for raw materials, WIP, and finished goods
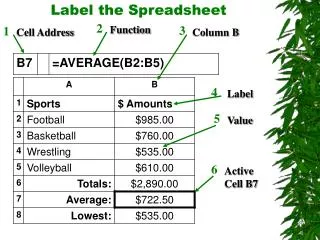
3. Service Level Management should define this
Statistically based calculation
The higher the desired level, the higher the inventory
Manually enter the value by category
4. Lead time In this spreadsheet it is defined in months
Examples: one week lead time = 0.25, six week lead time is 1.50
Enter manually the value you have in your system or lookup by category
5. Safety Stock Levels Safety stock levels can be set by experience
Safety stock is to guard against fluctuations in either supply or demand
Relates to desired service level
Having SS does not ensure availability, not having SS does not mean that you will necessarily have a stockout
Put into this spreadsheet what you have in your system (manual or lookup)
6. Demand Data You will need accurate monthly demand or usage data for some time span
Entering a larger number of periods will dampen variations
The information can be entered manually or via lookup
The original concept was to have a rolling 12 months of data entered
7. Lot Size Enter (manually or via lookup) the lot size information you use in your system
This affects the cycle stock calculation
Smaller lot sizes will decrease the average cycle stock amount and reduce dollars
8. Uses Pivot Table shows different categories of inventory
Clearly shows issues with variation and lead times
Provides targets for inventory planning
Can be used for budgeting and �what if� analysis
Can be used to explain to management
Clearly shows the opportunity dollars
Can also be used to show obsolete inventory category
Easy to view and update
9. Questions? File and presentation posted on Chapter Website
foothillschapter.homestead.com
Can contact me if you have questions
navy19831990@yahoo.com